
MSTX technical analysis March 2026 – outlook, support and resistance
Defiance Daily Target 2X Long MSTR ETF (MSTX) is a leveraged ETF designed to provide 2x daily exposure to MicroStrategy (MSTR), which itself is heavily tied to Bitcoin moves and high‑beta tech sentiment. As a result, MSTX tends to show amplified volatility, sharp intraday swings, and strong sensitivity to both crypto and broader risk‑on/risk‑off conditions.
In March 2026, traders are watching MSTX because it has undergone a deep drawdown from prior elevated levels, is trading near the low end of its 2026 range, and is reacting strongly to day‑to‑day moves in Bitcoin and MicroStrategy. This article looks at the current trend, key support and resistance, plus RSI, MACD and volume behaviour to help short‑term traders structure their scenarios rather than chase noise.

Current Price Trend in March 2026
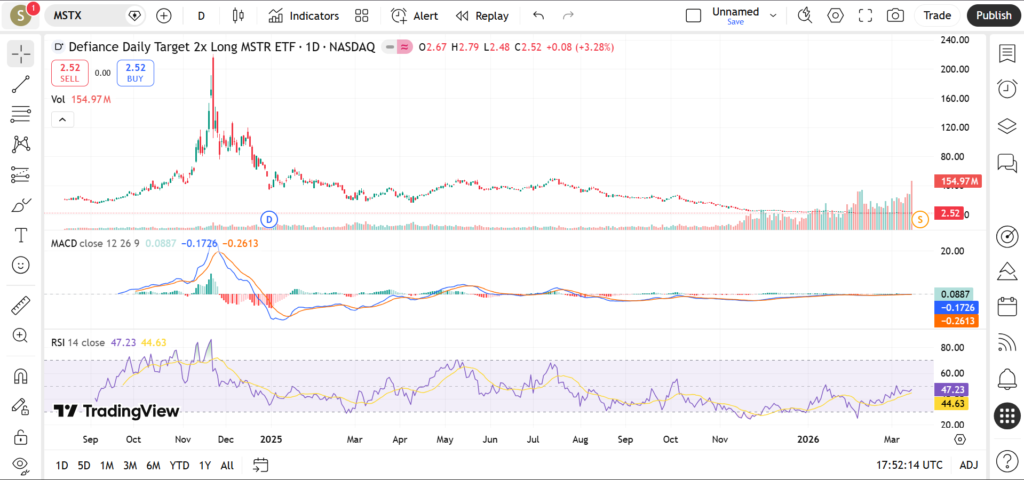
MSTX is in a short‑term downtrend in early to mid‑March 2026 after a very steep decline since the start of the year. Price has fallen from above 4 in late January 2026 to the low‑2s by late February, with recent daily candles showing lower highs and a cluster of closes around the 2.3–2.7 area. This places the ETF near the lower segment of its 2026 trading range, following an even larger collapse from much higher 2025 levels.
On a moving‑average basis, the 20‑day average has started to roll over sharply after tracking the selloff from late January, while the 50‑day average is positioned higher, reflecting the previous, richer price zone earlier in the year. The 200‑day average is likely well above current price, consistent with the long‑term downtrend that began after the ETF’s prior parabolic phase in 2025. For many traders, this alignment – price below the 20‑, 50‑ and 200‑day moving averages – is characteristic of a bearish environment where bounces are often viewed as potential mean‑reversion rallies within a broader downtrend rather than the start of a confirmed new bull leg.
Recent swings show very fast drops followed by sharp but short‑lived rebounds, typical of leveraged, crypto‑sensitive products. For example, daily moves of more than 10–20% were seen on several sessions in early February as MSTX reacted to MicroStrategy and Bitcoin volatility. Traders may treat this environment as suitable mainly for intraday or very short‑term swing strategies where risk management is tight and position sizing is conservative.
Key Support and Resistance Levels
Because of MSTX’s volatility and the large drawdown, support and resistance zones are often wide and can be tested multiple times in quick succession.
Key support levels
- First support zone: recent closes in the low‑2s
The area around the recent lows in February (roughly the 2.0–2.2 region on many platforms) represents the first key support zone, where several down days stabilized and intraday dips were bought. A sustained close below this band could signal that sellers are regaining control and may open room toward fresh 2026 lows. - Deeper support: early February intraday washout
During early February, MSTX printed a sharp intraday low around the mid‑1s before bouncing strongly by the close, leaving a long lower wick on the candle. That zone acts as a “capitulation‑style” support; revisiting it could indicate renewed downside pressure in MicroStrategy or Bitcoin, and a decisive break below might warn of another leg of forced liquidation. - Psychological support: the 2.00 handle
Round numbers often attract orders, and the 2.00 level has repeatedly appeared as an approximate pivot in February trading. A firm hold above this level can encourage short‑term dip buyers, while a clear break and consolidation beneath it could shift sentiment more firmly bearish for March.
Key resistance levels


- First resistance: recent swing highs in late February / early March
The zone around recent bounce highs (roughly mid‑2s to high‑2s on daily charts) is the first resistance band where several rally attempts stalled. A daily close above this area could signal that short‑term momentum is turning in favour of the bulls, potentially targeting higher moving‑average clusters. - Moving‑average resistance: 20‑ and 50‑day lines
The downward‑sloping 20‑day moving average currently sits above spot price, acting as dynamic resistance on rallies. The 50‑day average, located higher still, marks a more medium‑term hurdle; if price can reclaim and hold above the 20‑ and then 50‑day averages, traders may start to talk about a more meaningful recovery leg within the broader downtrend. - Higher resistance: January swing area above 3
Late‑January trade saw MSTX oscillate around the 3–4 area before the breakdown. Any return to and rejection from this region would remind traders of prior supply overhead, while a sustained break back into that band would be a strong signal of a structural shift in sentiment toward MicroStrategy and Bitcoin.
For active traders, how price behaves around these zones – whether it shows rejection tails, strong closes, or high‑volume breakouts – can help frame bullish and bearish scenarios without committing to fixed predictions.
Indicators – RSI, MACD, Volume
On many daily charts, RSI for MSTX has been hovering near or below the neutral 50 line for much of late February and early March, reflecting a market that has shifted from extreme downside momentum to a more balanced but still fragile state. Brief dips toward oversold territory likely occurred during the early February washout when price probed the mid‑1s before rebounding, signalling short‑term exhaustion among sellers. Currently, a move back above 50 on RSI with price reclaiming near‑term resistance could indicate improving momentum, whereas fresh drops toward 30 would warn that selling pressure is reviving.


MACD, which tracks trend and momentum, has likely shown a bearish configuration through most of 2026 so far, with the MACD line below the signal line and both below zero after the steep January–February decline. In the recent consolidation, the distance between the MACD and its signal line may have started to narrow, suggesting that bearish momentum is slowing rather than accelerating. A bullish crossover (MACD line moving above the signal line) on the daily chart, especially if it occurs near the zero line, could be an early sign that a short‑term base is forming.
Volume has been elevated and erratic, with clear spikes on sharp down days and on big intraday reversals. Early February saw very high turnover as the ETF plunged to its intraday low and then sharply reversed, indicating a combination of panic selling and opportunistic buying. Subsequent sessions in late February and early March generally show moderating but still above‑normal volume, which is typical when a leveraged product moves into a choppy consolidation after a major trend move.
Short‑Term Outlook for MSTX in March 2026
Taken together, MSTX’s technical picture in March 2026 is that of a leveraged ETF still in a broader downtrend but trying to stabilize after a deep decline. Price sits well below long‑term moving averages, yet short‑term momentum indicators suggest that the most aggressive phase of selling may have passed for now, leaving room for range‑bound or mean‑reversion trades while traders wait for the next strong signal from MicroStrategy and Bitcoin.
Because MSTX is tied to a single, volatile underlying stock and amplified 2x daily, its short‑term outlook depends heavily on crypto sentiment, regulatory headlines, and broader risk appetite. Traders may prefer to think in terms of scenarios – bounce toward the 20‑day average, breakdown below recent lows, or sideways chop – rather than a single fixed forecast.
What traders are watching
- Reaction to the recent low‑2s support zone and whether dips toward or below 2.00 attract buyers or trigger another wave of selling.
- Price action around the mid‑2s to high‑2s resistance band, especially if accompanied by a turn higher in RSI and a bullish MACD crossover.
- Bitcoin and MicroStrategy headlines, including any regulatory developments or major corporate announcements that can rapidly shift sentiment.
- Changes in volume patterns: whether new rallies occur on expanding volume or whether bounces appear on light, fading volume.
- Broader risk sentiment in tech and growth stocks, as strong moves in high‑beta equities often spill over into leveraged satellite products like MSTX.
Risks and Important Notes
Technical levels on a highly volatile leveraged ETF can fail quickly, especially around macro events, sudden Bitcoin moves, or unexpected corporate news from MicroStrategy. Gaps, intraday whipsaws, and tracking error relative to the underlying can all cause price to move through support or resistance levels faster than traditional indicators would suggest.
Because MSTX is designed for daily 2x exposure, it is subject to compounding and decay effects over time, meaning its longer‑term path can diverge significantly from the underlying stock’s cumulative performance. This makes it more suitable for short‑term tactical trading than for long‑term “set‑and‑forget” holding. Traders should also be aware of liquidity conditions, bid‑ask spreads, and their own risk tolerance; nothing in technical analysis guarantees outcomes, and any trade plan should be adapted to personal circumstances.
In summary, traders who follow MSTX in March 2026 may want to keep focusing on the interaction between price and the nearby support/resistance zones, while monitoring momentum indicators and volume for confirmation rather than relying on a single signal. Educationally, MSTX offers a clear example of how leveraged ETFs can magnify both opportunities and risks when underlying assets are in a high‑volatility regime.
For more context on leveraged and thematic ETFs, you might next review technical analyses of other crypto‑linked or tech‑leveraged funds, as well as broader equity index ETFs, to compare how different structures behave during similar macro conditions.