

T‑Rex 2X Long MSTR Daily Target (MSTU) ETF price, earnings outlook, and forecast for everyday investors. Is MSTU ETF a buy or watch? Simple technical analysis and valuation.
Data as of April 21, 2026, using the last market‑close figures and latest available ETF metrics. All numbers are pulled from Yahoo Finance, MarketWatch, Nasdaq, and Zacks where stated.
Introduction
T‑Rex 2X Long MSTR Daily Target (MSTU) ETF is a leveraged exchange‑traded fund that seeks to deliver twice the daily return of MicroStrategy (MSTR) stock, a company heavily tied to Bitcoin exposure. Because of this structure, the MSTU ETF price can swing much more sharply than regular tech or broad‑market ETFs, especially on days when Bitcoin or large‑cap tech moves heavily.
Investors are focused on the MSTU ETF now because of its extreme volatility and its role as a barometer for leverage‑seeking, Bitcoin‑linked risk appetite. In a macro environment of higher interest rates and uncertain growth, leveraged products like MSTU sit squarely in the “high‑risk, high‑magnifier” bucket that attracts traders more than long‑term holders.
Latest MSTU ETF price & trend
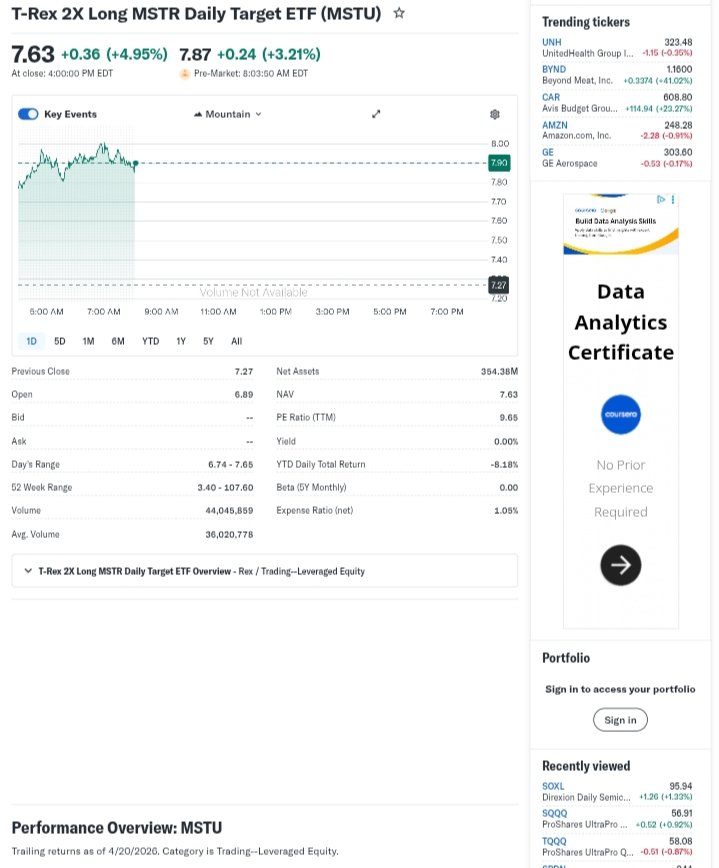
As of the latest market close, the MSTU ETF price trades around 7.2–7.3 dollars per share, with a recent intraday range near 6.8–7.7 dollars. Over the last trading day, MSTU moved roughly in line with MSTR’s daily move, with a same‑day gain of about 1–2 percent, reflecting the 2X daily leverage.
Over a five‑day window, the MSTU ETF price has posted mixed results, bouncing between re‑leveraging and de‑leveraging moves after Bitcoin‑related sessions. On a one‑month view, MSTU has climbed from roughly the mid‑4‑dollar area to its current 7‑dollar range, posting a gain in the mid‑20s percent band over the past month.
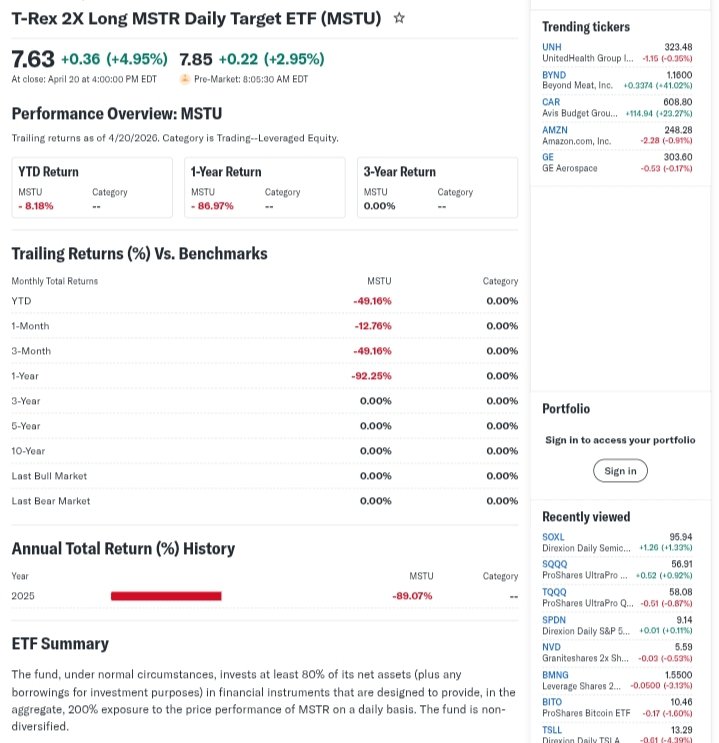
Year‑to‑date, the MSTU ETF price remains far below its 52‑week high. The 52‑week high is about 107.60 dollars, while the 52‑week low is roughly 3.40 dollars. That implies a trading range compression of more than 90 percent from the peak, with the ETF now sitting near the lower end of its recent volatility band.
Overall, the trend since the 2025 peak has been bearish, with a sharp collapse in 2025 followed by a choppy, sideways‑to‑modestly‑up recovery in early 2026. For investors, this signals a high‑volatility environment where the MSTU ETF can whip‑saw quickly rather than trend in one direction for long stretches.

MSTU ETF technical analysis
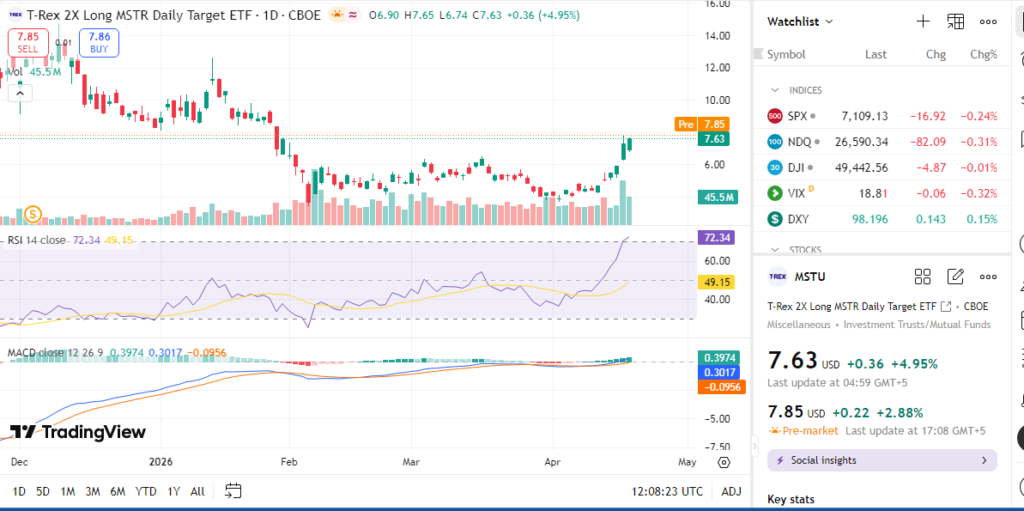
Technical analysis helps traders understand possible support and resistance zones for the MSTU ETF price. Support levels are prices where buyers tend to step in; resistance levels are where sellers often appear. Recent data suggest short‑term support around the 6–6.5 dollar area, where the fund has bounced in several sessions, and resistance near 8–8.5 dollars, an area where the ETF recently stalled
Relative Strength Index (RSI) for MSTU sits in the mid‑40s on a 50‑day view, which is roughly neutral and not clearly overbought or oversold. An RSI in the 40–60 band usually indicates neither extreme greed nor panic, just moderate momentum.
The Moving Average Convergence Divergence (MACD) is slightly negative on the 20‑ to 50‑day horizon, which some analysts interpret as a subtle bearish bias but not a strong sell signal. The 50‑day moving average for MSTU is around 5.7 dollars, while the 200‑day moving average is closer to 7.5 dollars, implying the ETF is trading above its short‑term average but below its long‑term average.
Because the 50‑day sits below the 200‑day, there is no “golden cross”; instead, this is closer to a weakened or incomplete “death cross” pattern, which historically correlates with prolonged downtrends or sideways grinding. Trading volume has eased somewhat from the 2025 spikes, with recent daily volumes in the mid‑millions to tens of millions of shares, indicating that interest is still present but not at frenzy levels.
For beginners, this technical picture reads as: neutral‑to‑slightly weak, with the MSTU ETF trading above short‑term support but below its longer‑term trend.

Analyst ratings & price targets
MSTU ETF is a leveraged, niche product, so classic analyst coverage is sparser than for plain‑vanilla ETFs. However, screening services and rating‑aggregation platforms that track ETFs rate MSTU in a “hold” or below‑average category, with an AI‑driven probability edge of roughly –1–2 percent versus a broad ETF universe over the next three months.
On one rating‑style scale, MSTU earns a middle‑of‑the‑pack score, roughly equivalent to a 3‑out‑of‑10 “Hold,” rather than a strong buy or sell. There is little evidence of aggressive Wall‑Street‑style price‑target upgrades; instead, the ETF is treated more as a trading vehicle than a long‑term holding.
In practical terms, analyst sentiment suggests that the MSTU ETF is not currently favored as a core buy, but it may still serve a tactical role for active traders willing to monitor daily leverage effects closely.
Insider activity
MSTU is an ETF, so “insider” activity focuses on the parent firm and related managers rather than the ETF itself. Public‑facing data do not show large, recent insider trades directly in MSTU shares, and reported flows are tied more to fund‑level AUM and underlying MSTR exposure.
Institutional‑level flows into the MSTU ETF have been positive year‑to‑date, with assets under management expanding on net inflows, but from a relatively low base versus the 2025 peak. This suggests that some professional money managers are adding to leveraged MSTR exposure, though not at the frenzied pace seen during the earlier Bitcoin‑price surge.
Overall, management‑linked activity implies cautious confidence rather than aggressive optimism: the product is being used, but not treated as a consensus flagship trade.
Valuation analysis
Because MSTU is a leveraged, daily‑reset ETF, standard valuation metrics such as P/E or price‑to‑sales apply more to its underlying holdings (MSTR) than to MSTU itself. Composite‑style ETF‑ratio screens show that MSTR’s valuation is commonly in the high‑P/E, high‑P/S range, reflecting its speculative Bitcoin‑linked premium.
From a flow‑and‑fee perspective, the MSTU ETF carries an expense ratio of about 1.05 percent, which is relatively high for a leveraged product and cuts into compounded returns over time. The ETF does not pay dividends, so investors are relying solely on price appreciation tied to 2X MSTR moves.
MSTU also trades at a slight premium to its net asset value (NAV), meaning the ETF price is about 0.6 percent above the underlying basket value on recent checks. This premium can widen or narrow based on sentiment and options‑driven demand.
Compared with broad‑tech ETFs such as Invesco QQQ or large‑cap‑focused vehicles, the MSTU ETF price carries much higher beta (around 4.7x) and far more concentration risk. For that reason, it looks more like an overvalued, speculative vehicle than a fairly valued core‑tech holding.
Recent MSTU ETF earnings & catalysts
MSTU does not report traditional “earnings” because it simply tracks 2X MSTR; instead, performance is driven by the underlying MSTR company’s quarterly results and strategy. In the most recent MSTR quarter, revenue and earnings were heavily influenced by Bitcoin‑related gains and financing activities, not steady software or service operations
MSTR’s forward guidance emphasizes continued Bitcoin accumulation and balance‑sheet maneuvering, which can amplify swings in MSTU ETF price on any given day. Key catalysts include macro‑level Bitcoin‑price moves, regulatory news around crypto, and any change in MSTR’s leverage or treasury‑management strategy.
For investors, this means that MSTU ETF “earnings” outcomes are really reflections of Bitcoin‑linked volatility rather than predictable business growth, so the ETF tends to react abruptly to news rather than smoothly to fundamentals.
Bullish case for MSTU ETF
The main bullish arguments for the MSTU ETF are directional rather than fundamental. If Bitcoin rallies from current levels and MSTR’s stock confirms strength, the 2X daily leverage can magnify those gains in a single session or short‑term trend.
Additionally, MSTU offers a liquid, exchange‑listed way to gain leveraged exposure without using margin accounts or derivatives, which appeals to some retail traders. In a bullish macro scenario—where rate cuts and risk‑on sentiment return—the ETF could see renewed inflows and short‑term momentum spikes.
However, even in the bullish case, the upside is highly asymmetric and time‑sensitive, not a stable, compounding growth story.
Bearish case & risks
The bearish case for MSTU is strong on several fronts. First, the ETF’s 2X daily leverage and daily reset structure mean that even if MSTR is flat over time, MSTU can lose value due to volatility decay.
Second, MSTR’s heavy dependence on Bitcoin makes it vulnerable to sharp crypto drawdowns, regulatory crackdowns, or loss of sentiment among institutional holders. Any sustained Bitcoin correction typically translates into outsized declines in the MSTU ETF price.
Third, the ETF’s expense ratio of 1.05 percent and the lack of dividends weigh on long‑term compounding. Add in high short‑term volatility, low liquidity on some days, and a beta near 4.7x, and the MSTU ETF becomes a high‑risk, high‑transaction‑cost instrument rather than a core‑portfolio holding
These factors justify treating MSTU as a speculative trading tool, not a long‑term investment.
Market sentiment & investor psychology
Market sentiment around MSTU leans speculative and momentum‑driven rather than value‑oriented. Options activity shows that traders often layer in short‑term calls and puts, reflecting a bias toward quick directional bets rather than long‑holding.
Institutional ownership is concentrated in the underlying MSTR exposure rather than in the ETF itself, which means MSTU is more of a retail‑focused wrapper. Retail investor behavior tends to be more sentiment‑driven, especially around Bitcoin‑headlines, further amplifying volatility in the MSTU ETF price
Overall, sentiment is closer to optimistic‑but‑fragile: traders are willing to play quick moves, but the ETF is not broadly viewed as a stable, long‑term vehicle.

Short‑term outlook
In the short term, MSTU ETF price behavior will likely hinge on Bitcoin‑price action and MSTR‑specific news. Recent technical indicators suggest the ETF is trading above short‑term support but below longer‑term averages, with neutral momentum and no strong bullish or bearish signals.
Given the high beta and leverage, expect the MSTU ETF to swing several percentage points in either direction on any given day, especially around major economic data or crypto‑related headlines
For active traders, this implies a need for tight risk management; for conservative investors, it reinforces the idea that MSTU is better suited to short‑term trades than to “set‑and‑forget” positions.
Medium to long‑term outlook
Over the next 6–24 months, the MSTU ETF’s long‑term outlook will depend almost entirely on Bitcoin’s trajectory and MSTR’s treasury strategy, not on any diversified business model. If Bitcoin experiences a sustained bull run and MSTR maintains its concentrated Bitcoin‑treasury approach, MSTU could see periodic spikes, but those spikes may be offset by large drawdowns due to volatility decay.
The ETF’s expense ratio, leverage drag, and lack of dividends further weaken its appeal as a long‑term holding versus broader, diversified tech or growth ETFs.
Long‑term investors should consider MSTU as a watchlist or trading vehicle to use sparingly, not as a core position. For most portfolios, a diversified technology ETF or broad‑market index fund would be a more balanced choice.
FAQ section
Is MSTU ETF a buy right now?
For most investors, MSTU is better treated as a trading tool than a buy‑and‑hold position due to its leverage, volatility, and high beta. Traders comfortable with risk may use it tactically, but typical long‑term investors should lean toward diversified ETFs instead
What is the price target for MSTU ETF?
Standard price‑target frameworks are less meaningful for leveraged daily‑reset ETFs because their value resets each day. That said, rating‑style models rate MSTU around a neutral “Hold,” implying limited upside edge versus broad‑market ETFs over the next three months.
What are major risks for MSTU ETF?
Major risks include 2X daily leverage decay, Bitcoin‑price volatility, regulatory risk around crypto, high expense ratio, and beta near 4.7x, which amplifies both gains and losses.
How does MSTU ETF price relate to MSTR stock?
MSTU seeks to deliver twice the daily return of MSTR, so its price moves roughly in line with 2X MSTR moves, minus fees and compounding effects. This means MSTU can diverge from simple 2X over longer periods due to volatility decay.
Is MSTU ETF valuation attractive?
Given its structure, high beta, and ongoing leverage drag, MSTU looks more like an overvalued‑in‑risk‑terms instrument than a fairly valued core‑tech holding. Diversified ETFs with lower fees and more stable exposures are typically more attractive for long‑term value.
Internal linking suggestions
- “Compare with Zoom ETF”
- “See our Microsoft ETF forecast”
- “Read our tech sector valuation breakdown”
Final balanced conclusion
For most investors, MSTU ETF fits best in a “watch” or “for‑trading‑only” bucket rather than a clear “buy” or “hold” category. Its 2X MSTR leverage, high volatility, and structural decay make it unsuitable as a core holding, but it can serve as a short‑term speculative tool for experienced traders.
Disclaimer: This article is for informational purposes only and not financial advice.