

Analyze MSTU ETF price, technical analysis, forecast, and if MSTU ETF is a buy. T-Rex 2X Long MSTR Daily Target ETF rides MicroStrategy volatility. Get latest trends and insights for smart investing.
Introduction
MSTU ETF seeks 2x daily returns of MicroStrategy stock. MSTR holds massive Bitcoin bets. Investors watch MSTU ETF now amid crypto swings and AI hype ties. Markets face rate cuts but volatility spikes tech plays.
Bitcoin exposure draws leveraged bets. MSTU ETF surges on MSTR moves. Broader conditions mix Trump policies and inflation watch.
Latest ETF Price & Trend
MSTU ETF closed near $5.60 last market data shows. One-day range $5.40-$6.35 with 3.7% bounce from lows. Five-day trend volatile post sharp drops.


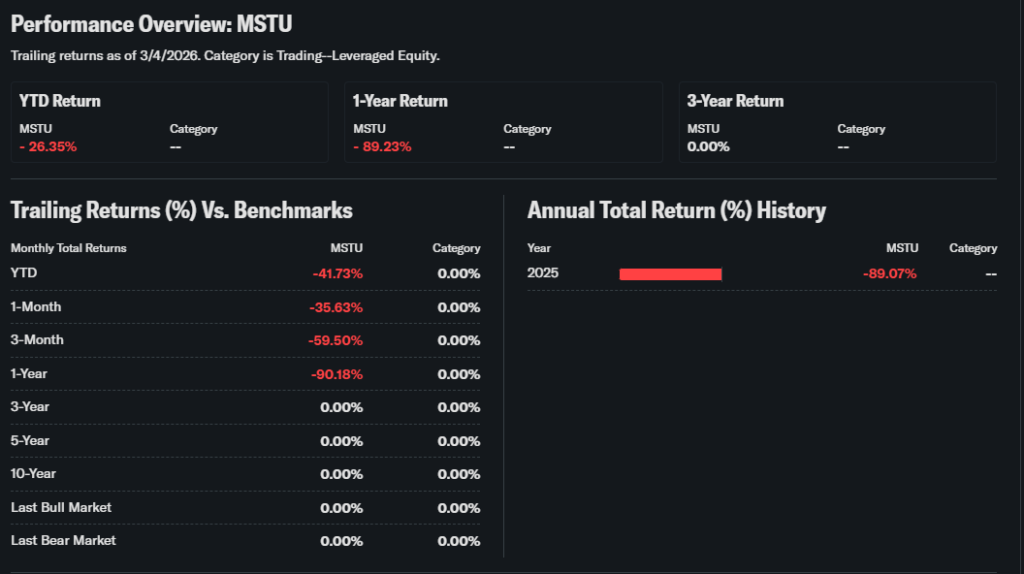
One-month down 16.81% as MSTR cooled. Three-month -58.55% NAV hit. Six-month -90.39% reflects crypto pullback. Year-to-date -89.07% from peaks.
52-week high around $100+ early; low near $4. Overall bearish trend dominates. Signals caution for longs; shorts eye decay risks in leveraged funds.
Technical Analysis
Support at $5.01 key level. Below tests $4.64 Fib retrace. Resistance $8.50 then $9.05 volume nodes. Breaks dictate swings. Support/resistance shows where buyers sellers clash.


RSI neutral around 44 avoids extremes. Over 70 overbought sells; under 30 oversold buys. RSI tracks momentum speed for reversals.
MACD sell signal with negative histogram. Bearish cross lags upside. MACD compares averages spots trend shifts early.
50-day average $8.34 falling under 200-day. Death cross confirms downtrend. Moving averages smooth prices guide entries.
Volume spiked 40-80M shares lately. High flow matches volatility not conviction build.
Analyst Ratings & Price Targets
Few ratings on niche MSTU. Short-term models see 3.3% rise to $7.60-$11.07 band 90% odds. Zacks-style holds medium risk. No Wall Street upgrades noted.
Sentiment ties MSTR Bitcoin views. Leveraged nature amps caution for investors.
Insider Activity
ETFs lack insiders. MSTR side shows Saylor buys steady. No recent large sells. Trends signal Bitcoin confidence not caution.
Management holds firm implies long bias.
Valuation Analysis
No P/E for leveraged ETF. Expense ratio 1.05% standard. Assets $365M market cap small. NAV tracks 2x MSTR daily no debt direct.

Compare to DEFI or MSTX peers. Overvalued on hold due decay; tactical fair. Undervalued if MSTR rebounds sharp.
Recent Earnings & Catalysts
No ETF earnings. MSTR Q4 Bitcoin buys topped views. Debt funded holdings grew. Guidance ties crypto outlook.
Catalysts MSTR Bitcoin ETF filings. Earnings volatility crushed MSTU on reset drag.
Bullish Case
MSTR Bitcoin hoard wins on rallies. Leverage amps quick gains. Crypto demand surges possible. Daily reset favors up days strung.
MicroStrategy software steady base.
Bearish Case
Leverage decay kills holds. MSTR premium fades. Bitcoin drops crush 2x. High fees erode. Regulatory crypto risks.
Volatility margin no cushion.
Market Sentiment & Investor Psychology
Short interest rising on drops. Options call heavy but puts grow. Institutions light retail chases momentum.
Fearful bias now after -90% YTD. Value hunters wait.
Short-Term Outlook
Neutral RSI MACD bear. Volume volatile no trend. Momentum from MSTR Bitcoin watch. Sideways chop likely.
Medium to Long-Term Outlook
Weak for holds decay heavy. Crypto growth ties MSTR. Position leveraged volatile. Watch for tactical not accumulate long.
FAQ Section
Is MSTU ETF a buy right now?
Tactical maybe on MSTR dip. Avoid holds.
What is the price target for MSTU ETF?
$7.60-$11 short-term models.
What are major risks for MSTU ETF?
Decay Bitcoin drop leverage.
MSTU ETF forecast 2026?
Volatile MSTR track.
MSTU technical analysis summary?
Bearish death cross support test.
Suggestions
- Compare with SOXS ETF inverse
- See MSTR Bitcoin strategy analysis
- Read leveraged ETF volatility guide
Conclusion
Watchlist MSTU ETF. High reward tactical short-term. Long risks too big from decay.
Disclaimer: This article is for informational purposes only and not financial advice.