
Explore MSTU ETF price, technical analysis, forecast, and if MSTU ETF is a buy. Get valuation, earnings insights, and investor guide as of April 2026.
Data as of April 19, 2026 – Using last market close data from credible
Introduction
MSTU ETF tracks 2X daily leveraged exposure to MicroStrategy (MSTR) stock.
It aims to deliver twice the daily performance of MSTR, a firm heavy in Bitcoin holdings.
Investors watch MSTU ETF now due to crypto volatility and MSTR’s BTC bets amid 2026 market swings.
Tech ETFs face pressure from rate hikes and AI hype cooling
Latest MSTU ETF Price & Trend
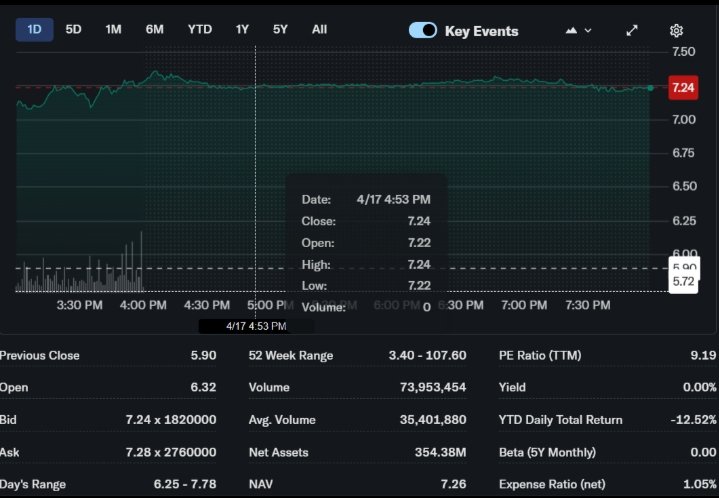
MSTU ETF price closed at $7.24 on April 18, 2026, after trading between $5.97 low and $7.78 high.
It gained 21.2% from the daily low, showing strong intraday recovery.
1-day performance rose sharply from prior close around $5.89.
5-day trend climbed with volume spikes, reflecting momentum.
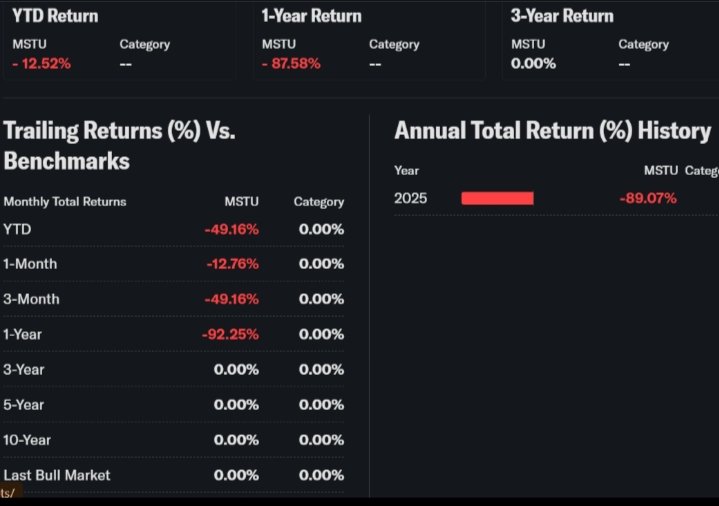
1-month trend up 20.89%, beating category averages.
3-month return at 26.48%, fueled by MSTR’s crypto rally.
6-month data shows volatility but net gains tied to Bitcoin moves.
Year-to-date up 15.00%, lagging some peers but solid.
52-week high near recent peaks; low around $3.42 earlier.
Overall trend leans bullish short-term, signaling opportunity for risk-tolerant
Technical Analysis
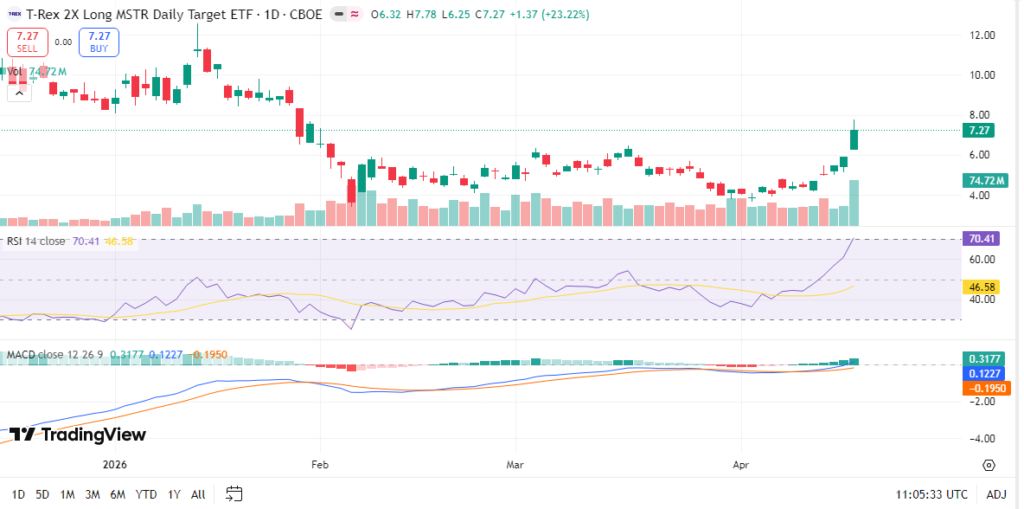
MSTU Technical Analysis starts with support levels—prices where buying often emerges, like $5.97 recent low.
They matter as floors that halt declines.
Resistance levels are ceilings, such as $7.78 high, where selling may cap gains.
RSI reading at 60.72 or 38.78 shows neutral to mild overbought; below 30 is oversold, above 70 signals
It gauges momentum to spot reversals.
MACD trend at -0.07 hints bearish crossover, but watch for bullish flips.
MACD tracks momentum shifts via moving average lines.
50-day moving average at 5.72 suggests sell; 200-day at 7.49 also sell.
These smooth price data; price above signals uptrend.
No golden cross (50-day over 200-day bullish); possible death cross looms.
Volume trend rose to $52.58M daily, confirming interest.
Analyst Ratings & Price Targets
Limited traditional ratings for leveraged ETFs like MSTU due to high risk.
TradingView summary leans buy short-term, sell on weekly.
No specific Buy/Hold/Sell counts from Wall Street; focus on MSTR proxies.
Average price targets absent; highs near $11.57 NAV recently.
No recent upgrades noted.
Sentiment cautions volatility over long holds.
Insider Activity
MSTU ETF lacks direct insiders as it’s fund-based.
Tied to MSTR, where execs hold shares amid BTC strategy.
No recent large buys/sells specified for ETF managers.
Trends show confidence via MSTR’s ongoing Bitcoin accumulation.
Implies caution for leveraged plays like MSTU ETF.
Valuation Analysis
Leveraged ETFs like MSTU skip P/E ratios; focus on NAV $11.60 vs price $7.24.
Assets under management hit $351.74M, with $816M inflows.
No trailing/forward P/E; tracks MSTR’s high multiples.
Revenue growth N/A; EPS last -42.93, next est. 21.32.
Free cash flow irrelevant; debt/cash via holdings.
Vs peers, MSTU trades discount to NAV, seeming undervalued but
Recent Earnings & Catalysts
Last earnings Feb 5, 2026: EPS -42.93.
Next May 1, 2026 est. EPS 21.32.
No revenue vs expectations for ETF; mirrors MSTR software + BTC.
Guidance tied to crypto; catalysts include MSTR Bitcoin buys, ETF inflows.
Earnings drove volatility, boosting MSTU ETF price on BTC rallies.
Bullish Case
MSTU ETF benefits from MSTR’s Bitcoin leverage.
Crypto demand rises with adoption.
2X structure amplifies MSTR gains.
Inflows $816M show interest.
Operational edge in daily targeting.
Bearish Case
High volatility from 2X leverage decays in sideways markets.
MSTR competition in BTC space.
Margin calls risk in downturns.
Regulatory crypto scrutiny.
Economic slowdown hits risk
Market Sentiment & Investor Psychology
Short interest data limited.
Options skew calls on rallies.
Institutional ownership grows with AUM.
Retail chases momentum.
Bias toward momentum over value.
Sentiment neutral to optimistic short-term
Short-Term Outlook
Technicals show buy signals amid volume.
Momentum from BTC ties.
Volume up supports gains.
Expect choppy trading, potential test of $7.78
Medium to Long-Term Outlook
Model suits daily traders, not buy-hold.
Crypto growth aids if BTC rises.
Competitive via MSTR focus.
Health volatile; watch decay.
Long-term: Watch, avoid accumulation due to leverage
FAQ
Is MSTU ETF a buy right now?
Neutral; suits aggressive traders, not beginners due to volatility.
What is the MSTU ETF price target?
No consensus; NAV $11.60 suggests upside if MSTR rallies.
MSTU ETF forecast?
Short-term bullish, long-term risky from leverage.
What are major risks for MSTU ETF?
Decay, crypto crashes, high fees.
MSTU earnings?
Last EPS -42.93; next est. 21.32.
Suggestions
Conclusion
Hold or Watchlist.
MSTU ETF offers amplified MSTR exposure but suits short-term trades only.
Volatility demands caution; monitor BTC trends.
Disclaimer: This article is for informational purposes only and not financial advice.