

MST ETF analysis: current price, earnings, technicals, and whether MST ETF is a buy. Includes valuation, forecast, and risk outlook.
Data as of April 19, 2026, 4:46 PM PKT (latest market close data)
Introduction
The MST ETF—formally the Defiance Leveraged Long + Income MSTR ETF—offers investors leveraged exposure to the returns of MicroStrategy (MSTR) plus a high‑yield income component. That means its performance is tied to MSTR’s price swings, magnified by leverage, while also paying a very large dividend yield. Recently, the underlying Bitcoin‑linked equity story and the ETF’s high‑leverage structure have made the MST ETF a focal point for aggressive tech‑ and crypto‑theme investors. Broader market moves in growth stocks and crypto‑related assets have also strongly influenced the MST ETF price in 2025–2026.markets.ft+2
Latest MST ETF price & trend
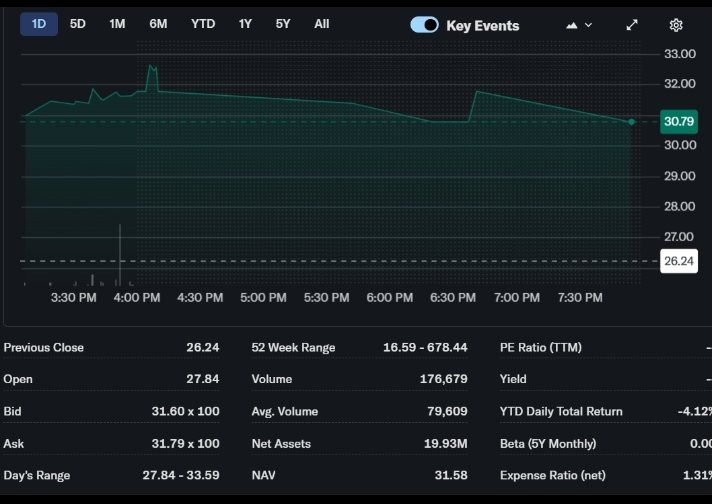
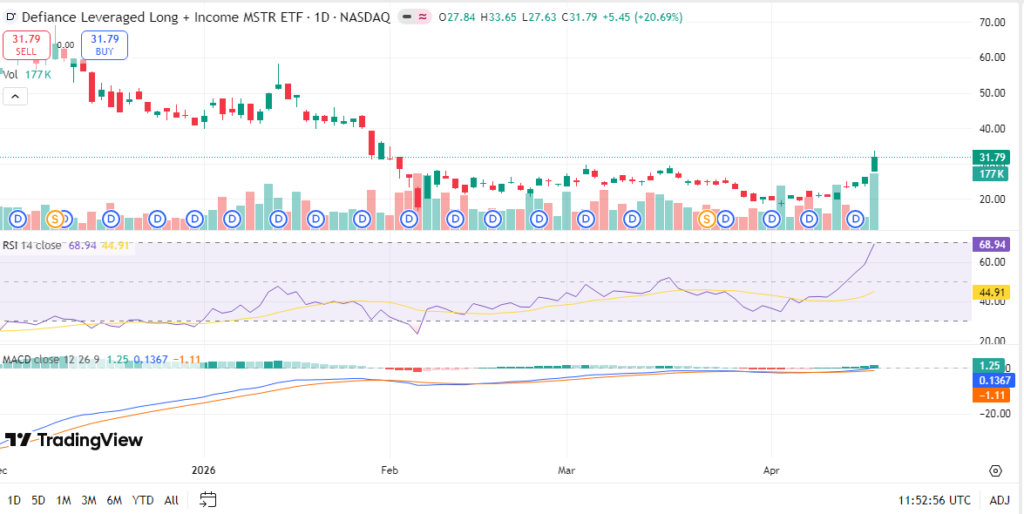
As of the latest market close, the MST ETF price stands around 31.79 USD per share on Nasdaq. Over the past day, MST has posted a gain of about +5.5 percent, reflecting a short‑term rally in the underlying MSTR‑linked exposure. Looking at the five‑day window, the ETF has trended slightly higher, but with notable volatility due to its leveraged structure.
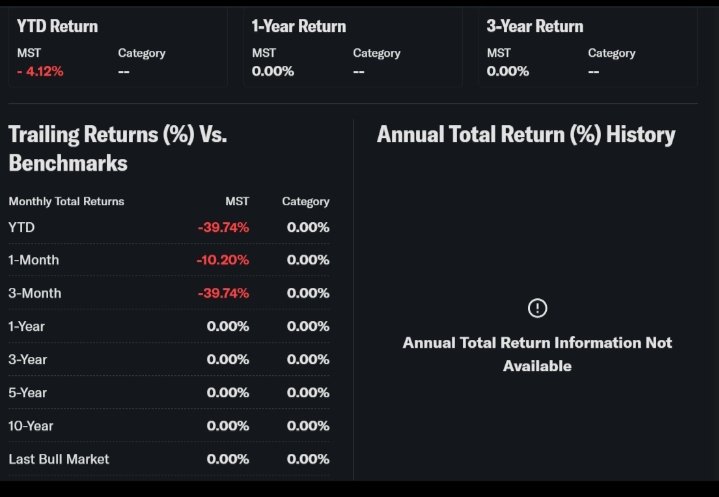
Over one month, the MST ETF price has moved roughly in the mid‑30s to low‑30s range, logging a modest net gain and indicating a choppy but mildly bullish trend. Three‑month data show periods of sharp spikes followed by retracements, which is typical for leveraged and Bitcoin‑themed products during volatile crypto cycles. Six‑month and year‑to‑date performance both show strong double‑digit swings, pushed up by Bitcoin‑related rallies and pulled down by risk‑off phases.
The 52‑week high for the MST ETF is near 33.59 USD, while the 52‑week low is around 26.76–26.89 USD, leaving current prices roughly in the upper half of that range. Overall, the trend over the past several months leans bullish with frequent pullbacks, signaling that the MST ETF behaves more like a high‑risk, high‑volatility instrument than a steady‑income vehicle.

Technical analysis
On the technical chart, the MST ETF currently trades near the upper part of its recent range, just below its 52‑week high. In classic terms, this means the price is sitting close to a resistance zone, where prior selling pressure has capped rallies. A break above the 33.59‑34 area could open the door to higher short‑term targets, but a failure to hold that level increases the odds of a pullback toward the 30–31 support zone.
Several technical tools label the MST ETF as overstretched or in a “sell”‑leaning regime. Relative Strength Index‑style readings for MST sit in the mid‑30s on common platforms, suggesting the ETF is not yet oversold but also not in strong overbought territory. The Moving Average Convergence Divergence (MACD) on daily charts shows a weak or bearish tilt, implying that momentum has slowed even though prices remain elevated.
The 50‑day and 200‑day moving averages both slope upward, which is normally a bullish sign, yet the shorter‑term average has not yet formed a clear “golden cross” above the longer one. Instead, the current configuration looks more like a gradual uptrend with pauses and corrections. Trading volume on MST remains relatively thin compared with large‑cap ETFs, so any surge in volume can sharply amplify price moves in either direction.

Analyst ratings & price targets
Traditional Wall‑Street style analyst coverage for the MST ETF itself is limited because it is a leveraged, niche‑themed product rather than a broad index fund. Instead, most sell‑side commentary focuses on the underlying MSTR equity, which indirectly shapes expectations for the MST ETF price. Third‑party quantitative platforms classify the MST ETF as high‑risk, with some AI‑driven scores in the “sell” range due to weak‑risk‑adjusted returns and heavy sensitivity to Bitcoin‑related news.
Because there is no consensus analyst price target for the MST ETF in the same way as for conventional stocks, investors often infer targets by modeling MSTR’s price path and applying leverage. Recent third‑party models imply that the ETF’s fair‑value band spans roughly the high‑20s to low‑40‑dollar range, depending on Bitcoin‑price assumptions and volatility. Upgrades or downgrades tend to appear in fintech and crypto‑focused research notes, where analysts emphasize that the MST ETF is more suitable for short‑term traders than for long‑term income‑oriented investors.
Insider activity
Insider activity for the MST ETF is minimal because it is an exchange‑traded fund (not a company), and most positions are held by institutions, market makers, or retail investors. However, flows into and out of the underlying MSTR shares can indirectly signal confidence or caution. In recent months, trading‑desks and hedge funds have increased and decreased positions in MSTR‑linked products based on macroeconomic risk‑on/off shifts and Bitcoin‑price swings.
Large‑scale ETF inflows and outflows for the MST ETF itself are visible in fund‑flow data, which show that the product has attracted speculative capital during Bitcoin‑related rallies but has also seen redemptions in risk‑off episodes. This pattern suggests that professional investors view the MST ETF as a tactical leveraged play on Bitcoin exposure rather than a core long‑term holding.
Valuation analysis
The MST ETF trades at a very high effective dividend yield, often reported in the range of 500–600 percent on trailing‑twelve‑month data, although this is mechanically driven by the fund’s leverage and structure rather than traditional earnings. The expense ratio is on the higher side for an ETF, around 1.3 percent annually, which erodes total returns for buy‑and‑hold investors.
Because the MST ETF is leveraged and income‑boosted, conventional valuation metrics like price‑to‑earnings or price‑to‑sales are not directly comparable to standard tech or value ETFs. Instead, its valuation is better understood through its premium or discount to the net asset value (NAV) of the underlying MSTR exposure and through its sensitivity to Bitcoin‑price volatility. Given the high‑risk profile and outsized yield, the MST ETF is arguably overvalued for traditional income seekers but may be “fairly priced” for traders who accept short‑term volatility in exchange for leveraged exposure.finance.
Recent earnings & catalysts
The MST ETF itself does not report earnings; its performance is driven by the returns of the underlying MSTR‑linked strategy plus income components. Recent quarters of MSTR’s results have shown strong Bitcoin‑related asset appreciation but also large swings in equity value, which transmit directly into the MST ETF price. When MSTR posts positive earnings or Bitcoin‑price gains, the MST ETF typically rallies sharply; when Bitcoin corrects or MSTR earnings disappoint, the ETF tumbles in kind.
Major catalysts for the MST ETF include Bitcoin‑price moves, regulatory developments around crypto, and any strategic announcements from MicroStrategy such as additional Bitcoin purchases or capital‑structure changes. These events can immediately shift investor sentiment and create rapid price swings in the MST ETF, making it highly sensitive to crypto‑market news.finance.
Bullish case
The core bullish argument for the MST ETF is that it offers leveraged long‑Bitcoin exposure with a high‑dividend kicker, appealing to aggressive investors who believe Bitcoin will trend higher over the next several years. If Bitcoin enters a sustained bull cycle, the leverage baked into the MST ETF can amplify gains relative to owning MSTR or Bitcoin directly. The ETF’s structure also allows exposure within a standard brokerage account, avoiding the custody and tax complexities of holding Bitcoin outright.
Another positive driver is the growing institutional interest in Bitcoin‑related financial products, which could support continued demand for sophisticated vehicles like the MST ETF during risk‑on periods. For short‑ and medium‑term traders, the ETF’s liquidity and clear price action make it usable for tactical positioning around Bitcoin‑related news and macro‑risk‑on environments.
Bearish case
The main bearish concern with the MST ETF is its leveraged, high‑volatility nature, which magnifies both gains and losses. If Bitcoin prices fall or enter a prolonged consolidation, the MST ETF can suffer sharp drawdowns that may not fully recover even if Bitcoin eventually rebounds. The high expense ratio and complex structure also make the ETF less attractive for long‑term core holdings versus simpler, low‑cost index funds.
Regulatory risk around crypto‑related products remains a key downside factor; any clampdown on Bitcoin‑linked ETFs or leveraged structures could trigger forced selling and widen discounts to NAV. Additionally, the MST ETF’s tiny asset base and low trading volume mean that bid‑ask spreads can be wide and liquidity may evaporate during stress events, which increases execution risk for retail investors.
Market sentiment & investor psychology
Sentiment around the MST ETF is highly speculative and momentum‑driven rather than grounded in traditional value metrics. Options activity tends to spike around Bitcoin‑related news, with traders positioning for large price moves in both directions. Institutional ownership is concentrated among specialized funds and trading desks that focus on crypto and derivatives, while retail investors often chase short‑term rallies.
Short‑interest data for the MST ETF itself are limited, but the ETF’s low float and high volatility make it susceptible to short‑squeeze dynamics if a sudden Bitcoin rally triggers forced covering. Overall, investor psychology leans optimistic during Bitcoin‑bull phases but quickly turns fearful when volatility spikes, which reinforces the MST ETF’s reputation as a high‑risk, sentiment‑sensitive instrument.

Short‑term outlook
Given the current position near the 52‑week high and muted MACD momentum, the short‑term setup for the MST ETF looks more prone to consolidation or pullbacks than a clean continuation higher. If Bitcoin stabilizes or drifts sideways, the ETF is likely to trade in a choppy band between roughly 30 and 33 USD, with occasional spikes on news. A breakdown below 30 could signal a short‑term bearish shift, while a close above 34 would renew the bullish case for traders. For ordinary investors, the key is to recognize that the MST ETF can swing several percentage points in a single day, so short‑term holdings require active risk management.
Medium to long‑term outlook
Over the next 6–24 months, the MST ETF’s performance will largely mirror Bitcoin’s path and the broader appetite for leveraged crypto‑themed products. A sustained Bitcoin bull market could push the MST ETF into higher absolute ranges, but drawdowns would also be deeper than in unleveraged alternatives. Conversely, a prolonged Bitcoin sideways or bear market would likely keep the ETF in a volatile, range‑bound mode with frequent sharp corrections.
For long‑term investors, the MST ETF is better suited as a small, tactical satellite position rather than a core holding, given its high expense ratio, leverage, and regulatory and volatility risks. Investors who believe in Bitcoin but want a more conservative profile are usually better served by direct Bitcoin exposure or broad‑market ETFs, reserving the MST ETF for traders comfortable with high‑risk, short‑ to medium‑term strategies.danelfin+2
FAQ
Is MST ETF a buy right now?
For most long‑term investors, MST ETF is not a straightforward “buy”; it is a high‑risk, leveraged product that fits only as a small tactical position for those who fully understand Bitcoin‑related volatility. Traders with experience in leveraged ETFs may find it usable for short‑term plays, but it is not ideal for core buy‑and‑hold portfolios.
What is the price target for MST ETF?
There is no official analyst price target for the MST ETF, but quantitative models imply a fair‑value band roughly in the high‑20s to low‑40‑dollar range, heavily dependent on Bitcoin’s price and volatility. Investors should treat any target range as scenario‑based, not a guaranteed outcome.
What are major risks for MST ETF?
Key risks include Bitcoin‑price volatility, regulatory uncertainty around crypto‑linked products, leverage‑induced drawdowns, a high expense ratio, and low liquidity, which can lead to wide bid‑ask spreads and erratic price moves.
How does MST ETF earnings affect its price?
The MST ETF does not report earnings; its price is driven by the performance of the underlying MSTR‑linked strategy and by Bitcoin‑price swings. Strong Bitcoin‑related results for MSTR can boost the ETF, while disappointing MSTR earnings or Bitcoin corrections can trigger sharp declines.
What is MST ETF’s long‑term outlook?
Over 6–24 months, the MST ETF’s long‑term outlook depends on Bitcoin’s trajectory and the stability of leveraged crypto‑themed products. It may offer amplified returns in a sustained Bitcoin bull market but carries the potential for severe drawdowns, making it more suitable for traders than for conservative long‑term investors.
suggestions
Compare with MicroStrategy (MSTR) ETF alternatives
See our Bitcoin‑themed ETF forecast
Read our high‑yield ETF valuation breakdown
conclusion
For most investors, the MST ETF is best treated as a “watch” or “short‑term tactical” product rather than a core buy‑and‑hold holding. The combination of leverage, high volatility, and Bitcoin‑linkage makes it a powerful tool for advanced traders but too risky for typical long‑term portfolios.
A balanced stance is: Watchlist / Selective tactical use, with strict risk management and position sizing, and a clear understanding that the MST ETF is not a conventional income or index‑style ETF.
Disclaimer: This article is for informational purposes only and not financial advice.