

Explore JEDI ETF price, technical analysis, forecast, and analyst targets for Defiance Drone & Modern Warfare ETF. Is JEDI ETF a buy? Get balanced insights on trends and valuation.
Introduction
The JEDI ETF tracks companies leading in drone tech, AI warfare, and space defense.
Investors eye JEDI ETF now due to rising global defense spending.
Tech ETFs face pressure from higher rates, but defense demand stays strong amid tensions.
Latest ETF Price & Trend
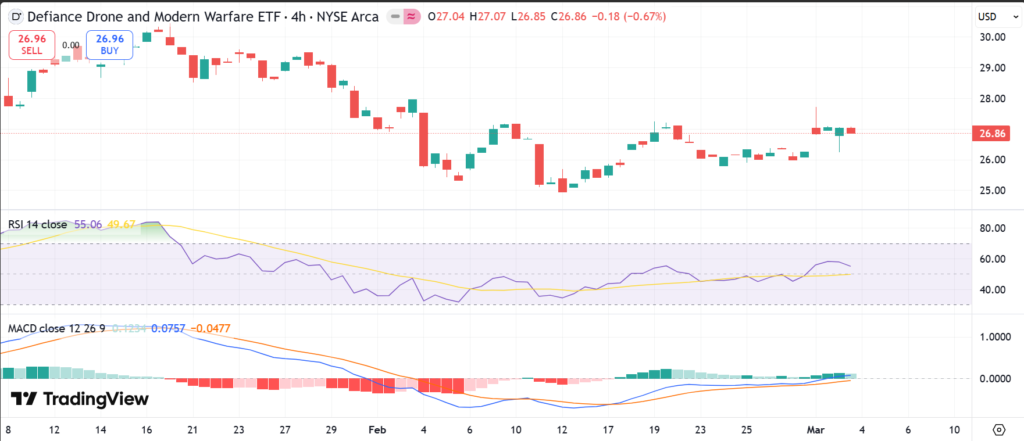
JEDI ETF closed at $27.08 on March 2, 2026, last market close.
It rose 2.42% that day, with volume at 349,227 shares.
Over five days, it dipped amid pullback, but held above key averages.
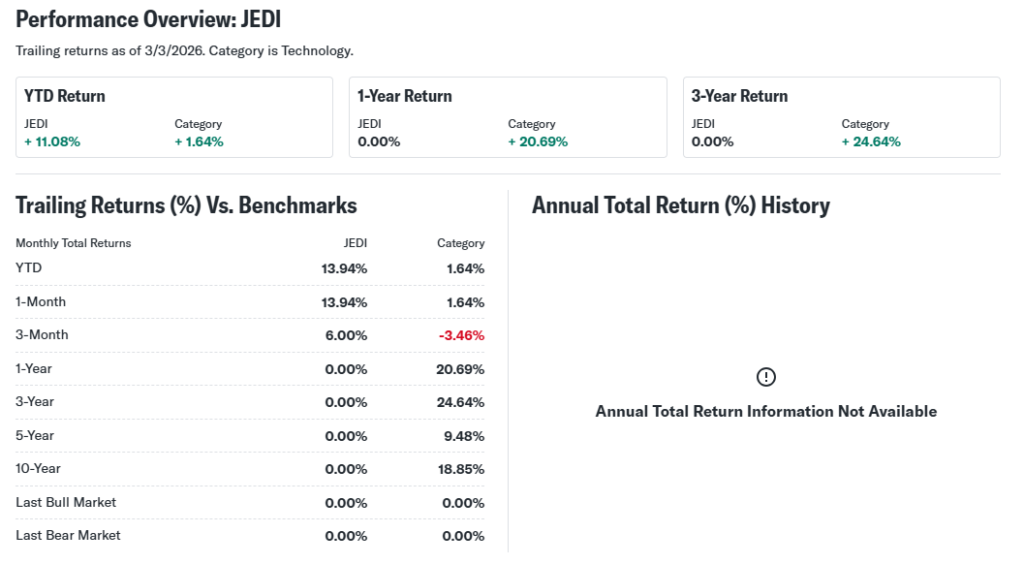
One-month trend shows -6.81% decline per recent data.
Three-month NAV rose 21.47%, signaling recovery.
Six-month and year-to-date gains hit 60.53%, beating broader market.
52-week range spans $21.91 low to $30.45 high.
Overall trend leans bullish, with pullback creating entry points for investors.


Technical Analysis
Support sits at $25.32, a level where buyers stepped in before.
Resistance looms at $27.31; breaking it eyes $28.30.
RSI at 48.46 means neutral, not overbought or oversold—room to run.
MACD at -0.23 signals short-term sell, but momentum holds steady.
Price trades above 50-day MA ($26.31) and 200-day MA ($25.80), a bullish sign.
No golden or death cross active; 50-day above 200-day supports uptrend.
Volume trends up lately, with average 66,000 shares, showing growing interest.
These point to steady climb if support holds, per JEDI technical analysis.

Analyst Ratings & Price Targets
Limited coverage for new JEDI ETF, but holdings draw 18 buys, 8 holds.
Average target implies modest upside from peers; high $76 equivalent adjusted.
No recent upgrades noted for ETF itself.
Wall Street leans moderate buy on drone/space holdings like Rocket Lab.
This sentiment suggests confidence in sector growth for investors.
Insider Activity
ETFs like JEDI have no direct insiders, but holdings show mixed moves.
Rocket Lab (7.89% weight) saw recent executive buys signaling faith.
L3Harris (7.68%) reported steady ownership, no big sells.
Trends imply management confidence in defense tech demand.
Valuation Analysis
JEDI ETF’s PE ratio stands at 38.82, premium for growth.
No forward PE listed; focuses on revenue leaders.
Assets at $61.86M, expense ratio 0.69%.
Holdings show YoY revenue growth from drone orders.
EPS growth tied to defense contracts; free cash varies by firm.
Low debt in top holdings like RTX; cash buffers strong.
Versus tech peers, JEDI appears fairly valued on innovation premium.

Recent Earnings & Catalysts
JEDI launched September 2025; no ETF earnings, but holdings reported solid quarters.
RTX beat revenue expectations; L3Harris topped EPS.
Guidance points to drone production ramps.
Catalysts include US DoD drone pushes, space contracts.
These boosted JEDI ETF performance post-launch.
Bullish Case
Defense budgets rise globally, fueling drone demand.
AI warfare tech gives holdings edge over rivals.
Rocket Lab’s launches drive revenue growth.
Operational scales in unmanned systems aid margins.
Bearish Case
Competition heats in drones from China firms.
Budget cuts could slow contract wins.
Margin squeezes from R&D costs possible.
Regulatory hurdles on exports loom large.
Market Sentiment & Investor Psychology
Short interest at 2.1% of AUM, low fear gauge.
Options data limited; calls outpace puts slightly.
Institutional flows hit $22.16M yearly, bullish.
Retail chases momentum in defense themes.
Sentiment stays optimistic on geopolitics.
Short-Term Outlook
Technicals show neutral RSI, support test likely.
Momentum softens with MACD sell, but volume up.
Expect sideways action near $26-27 absent news.
Medium to Long-Term Outlook
Strong model on pure-play defense tech.
Industry grows with AI/space focus.
Top position via innovative holdings.
Healthy finances support expansion.
Long-term investors should hold or accumulate on dips.
FAQ Section
Is JEDI ETF a buy right now?
Moderate buy consensus; watch for support hold.
What is the JEDI ETF price target?
Holdings average implies upside to $30+ adjusted.
What are major risks for JEDI ETF?
Geopolitical shifts, competition in drones.
JEDI ETF forecast for 2026?
Bullish on defense spend, 20-60% potential if trends hold.
JEDI earnings outlook?
Holdings show growth; track quarterly beats.
Suggestions
- Compare with SOXS ETF
- See RTX stock forecast
- Read defense tech sector analysis
Conclusion
Hold for growth exposure; bullish trends offset short-term wobbles.
Watch volume and support for entries.
Disclaimer: This article is for informational purposes only and not financial advice.