
IBIT Technical Analysis: Trend, Levels & Outlook March 2026
iShares Bitcoin Trust ETF (IBIT) is a spot Bitcoin exchange-traded fund that allows investors to gain direct exposure to Bitcoin through traditional stock markets. Managed by BlackRock, IBIT belongs to the cryptocurrency ETF sector and has become one of the most closely watched digital asset investment vehicles since the approval of spot Bitcoin ETFs in the United States.
Traders are closely monitoring IBIT in March 2026 as Bitcoin continues to attract institutional interest while remaining highly volatile. The ETF has seen significant inflows during bullish periods and sharp corrections when crypto sentiment weakens. In this analysis, we explore IBIT’s current trend, important support and resistance levels, and indicators like RSI, MACD, and trading volume to better understand the ETF’s technical setup during this period.
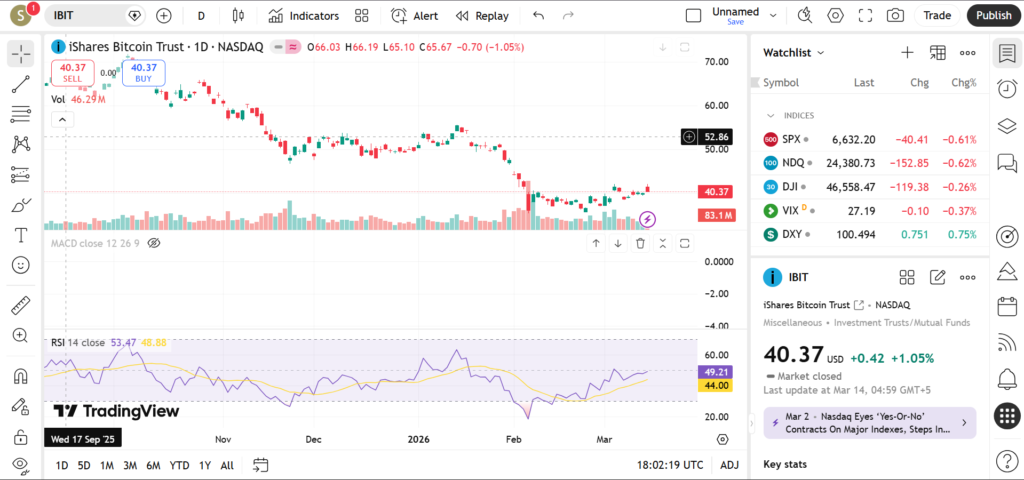
Current Price Trend in March 2026
IBIT has been trading in a moderately bullish structure with occasional sharp pullbacks, reflecting the volatile nature of Bitcoin markets. The ETF rallied strongly earlier in the year alongside a broader crypto market recovery, but recent price action suggests momentum is stabilizing.
The 20-day moving average has recently been trending upward and acting as short-term dynamic support. Pullbacks toward this moving average have often attracted buyers looking to participate in the broader trend.
The 50-day moving average also remains upward sloping, indicating that the medium-term trend is still constructive. IBIT has consistently traded above this level for several weeks, reinforcing the overall bullish market structure.
Meanwhile, the 200-day moving average sits much lower on the chart and serves as the primary long-term support level. Staying above this average generally indicates that the broader uptrend remains intact.
Recent price swings show a pattern of higher lows, although the ETF has struggled to break decisively above recent highs. This type of price behavior often indicates a consolidation phase where traders wait for new catalysts before the next directional move.
Key Support and Resistance Levels
Key support levels for IBIT include the recent swing low formed during the latest pullback, where buyers previously stepped in to stabilize the price. Another support zone lies near the 50-day moving average, which has historically acted as dynamic support during corrections.
A deeper support region appears near the 200-day moving average, representing the long-term trend floor. If the ETF were to approach this level, traders would likely watch closely for signs of renewed buying activity.
On the resistance side, the first key barrier sits near the most recent swing high, which previously triggered profit-taking. Another resistance area appears near previous consolidation highs, where the ETF struggled to sustain momentum earlier.
A decisive break above these resistance levels could signal renewed bullish momentum and potentially open the path toward previous yearly highs.
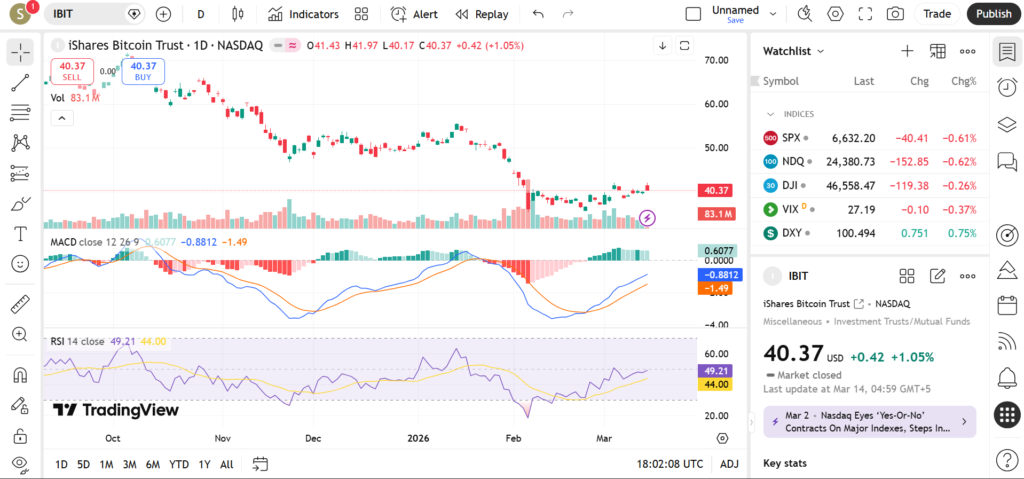
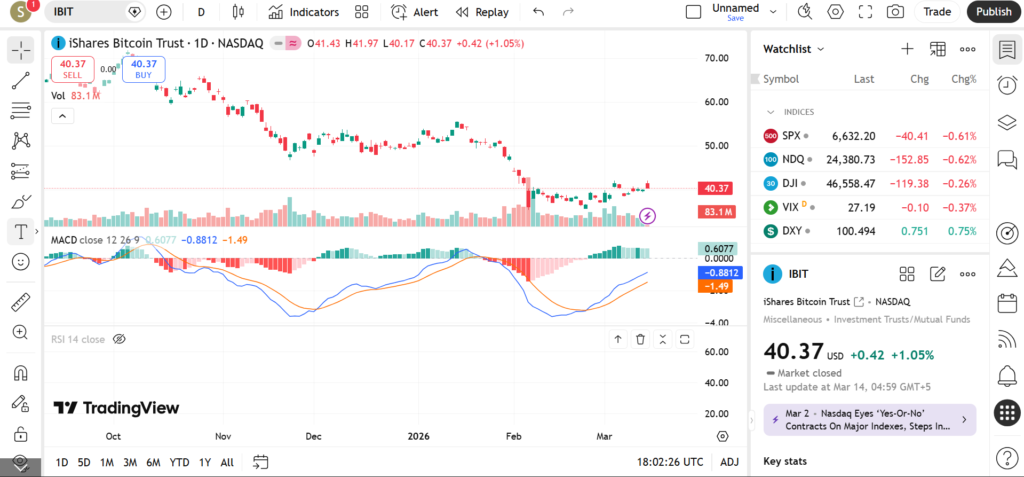
Indicators – RSI, MACD, Volume
The Relative Strength Index (RSI) for IBIT has recently been moving in the upper neutral range, suggesting moderate bullish momentum without reaching extreme overbought conditions.
The MACD indicator continues to show positive momentum overall, though the lines appear to be converging slightly, which sometimes indicates that the current rally is pausing.
Volume activity has been relatively strong during upward moves, reflecting ongoing institutional participation in Bitcoin ETFs. Pullbacks have generally occurred on lighter volume, which may suggest that selling pressure remains limited.
Short-Term Outlook for IBIT in March 2026
The technical outlook for IBIT remains cautiously bullish as long as the ETF holds above its medium-term moving averages. However, the recent slowdown in momentum suggests the possibility of sideways consolidation before the next major breakout.
Traders are watching several key factors:
• A breakout above recent swing highs
• Continued support near the 50-day moving average
• Bitcoin price movements influencing ETF demand
• RSI movement toward stronger bullish momentum
• Institutional inflows into spot Bitcoin ETFs
Risks and Important Notes
Technical analysis is useful for identifying potential trading opportunities, but price levels can fail due to unexpected events such as regulatory announcements, macroeconomic changes, or sudden shifts in cryptocurrency market sentiment.
Because IBIT directly tracks Bitcoin’s price, it remains exposed to the high volatility typical of digital asset markets.
This analysis is provided for educational purposes only and should not be considered financial advice.
For additional market insights, traders may also explore technical analysis of other crypto ETFs and related blockchain sector investments.
Recommended chart images