

iShares iBoxx $ High Yield Corporate Bond ETF (HYG) Technical Analysis
The iShares iBoxx $ High Yield Corporate Bond ETF (HYG) tracks U.S. dollar-denominated high-yield corporate bonds, offering exposure to riskier debt from companies with lower credit ratings. Traders watch HYG closely amid shifting interest rate expectations and economic uncertainty in March 2026, as high-yield bonds often signal broader market risk appetite. This article examines HYG’s short-term trend, key support and resistance levels, technical indicators like RSI and MACD, and a balanced outlook for retail traders navigating volatility.
High-yield bond ETFs like HYG have drawn attention due to potential Federal Reserve policy adjustments and corporate debt refinancing pressures. With President Trump’s administration influencing economic policies since his 2025 inauguration, fixed-income traders seek clarity on credit spreads and yield curves. We’ll cover price trends, pivotal levels, indicator signals, and short-term scenarios without prescribing trades.

Current Price Trend in March 2026
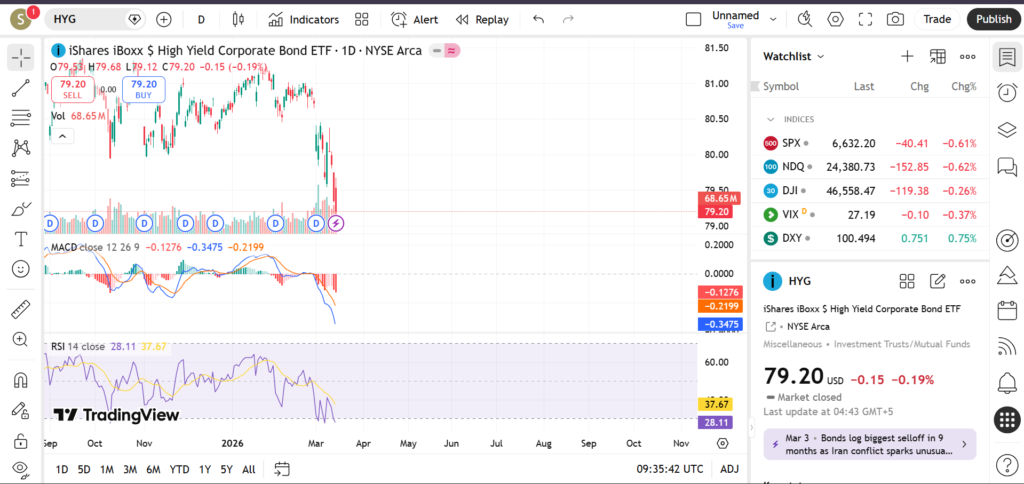
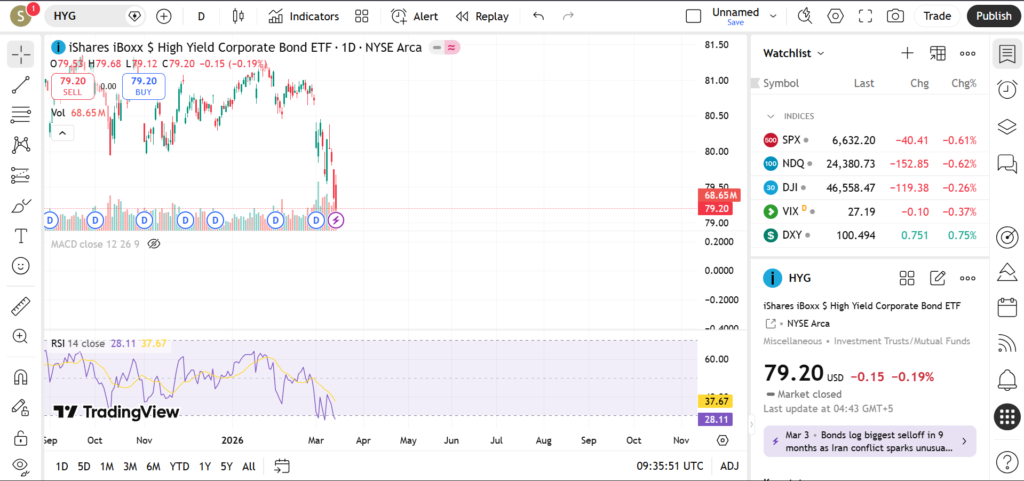
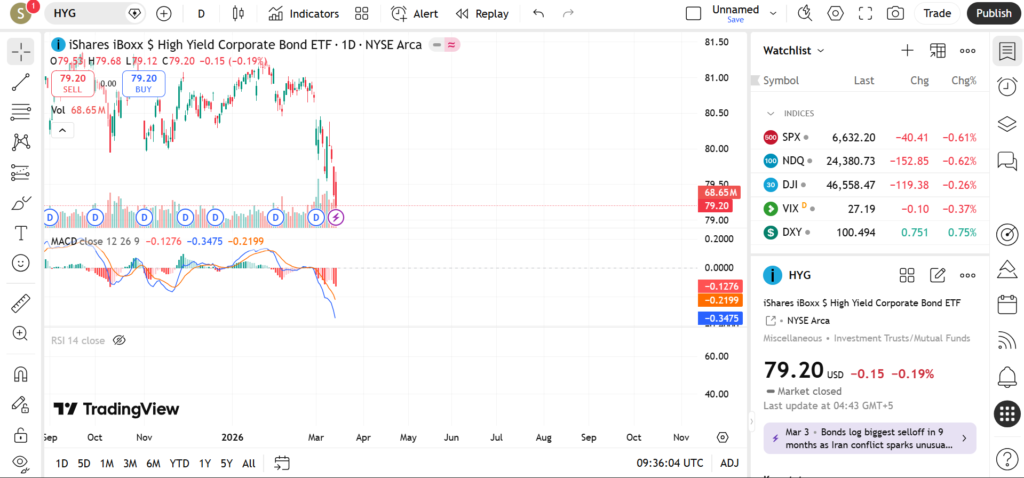
HYG exhibits a short-term range-bound trend in March 2026, oscillating between recent highs and lows without a decisive breakout. Price action shows consolidation after an early-year rally, with swings reflecting sensitivity to Treasury yields and credit market sentiment; for instance, a pullback from multi-month peaks near psychological round numbers has tested buyer conviction.
The 20-day moving average hovers near recent price action, acting as dynamic support, while the 50-day MA provides a midpoint in the range and the 200-day MA trails below, suggesting underlying longer-term uptrend resilience. Major swings include a bounce from February lows—likely tied to seasonal bond flows—and a rejection at upper range boundaries, educating traders on momentum limits during macro-driven sessions.
This setup teaches patience, as moving average alignments (like a 20-day above 50-day) hint at mild bullish bias, but lack of volume confirmation keeps the range intact. Retail traders may observe how price interacts with these averages for clues on potential shifts.
Key Support and Resistance Levels
Key supports for HYG cluster around prior swing lows and moving averages, offering potential buying interest zones.
- Support near 75.50: Aligns with the February swing low and approaches the 50-day MA; a hold here could signal continued range stability, while a break below might accelerate toward deeper lows, prompting caution on credit risk.
- Support at 74.00: A round number coinciding with a prior gap fill and 20-day MA extension; traders watch for volume pickup on tests, as defense here often precedes bounces in bond ETFs.
- Support around 72.80: Matches the 200-day MA and year-to-date low extension; sustained breach could indicate bearish momentum, potentially signaling wider credit spreads.

Resistance levels cap upside attempts, rooted in recent highs and psychological barriers.
- Resistance near 78.20: Recent swing high and upper range boundary; a decisive break above might target 52-week territory, suggesting improved risk appetite.
- Resistance at 79.50: Aligns with a multi-month high and 20-day MA convergence; failure here reinforces range trading, but penetration could draw in momentum chasers.
- Resistance around 81.00: Round number near prior gap resistance; overcoming this would signal bullish control, possibly fueled by rate cut hopes.
Breaks above top resistances could confirm uptrend resumption, targeting higher extensions, whereas support failures might indicate downtrend risks, urging traders to monitor stop levels.
Indicators – RSI, MACD, Volume
RSI (14-period) on HYG’s daily chart sits in neutral territory around 50 in March 2026, neither overbought (above 70) nor oversold (below 30), reflecting the range-bound price action without extreme momentum. This balance suggests room for movement in either direction, teaching traders to pair RSI divergences with price for confirmation rather than standalone signals.
MACD shows fading bullish momentum, with the signal line flattening after a prior histogram expansion; no clear crossover exists, but a potential bearish divergence from price highs warns of weakening upside. Traders may watch for line crosses—bullish if MACD rises above signal, bearish otherwise—as these often precede range escapes in bond ETFs.

Volume behavior remains subdued on rallies but spikes on pullbacks to supports, indicating stronger seller conviction during dips yet limited conviction for breakouts. Rising volume on upside tests would bolster bullish cases, while persistent low volume reinforces sideways grinding.
Short-Term Outlook for HYG in March 2026
HYG’s technical picture in March 2026 points to continued range trading amid neutral indicators and balanced supports/resistances, with upside capped until credit sentiment improves. Moving averages provide a bullish undercurrent, but volume and MACD hesitation suggest caution, as unexpected yield spikes could pressure the lower bounds.
Traders might position for range fades or breakouts, using levels as reference points while eyeing macro catalysts.
What traders are watching:
- Interaction with 75.50 support amid Fed commentary or CPI data releases.
- Volume surge on approach to 78.20 resistance, potentially signaling breakout.
- Credit spread widening from energy or retail sector reports.
- RSI divergence near range extremes for momentum shifts.
- Broader Treasury yield moves, as 10-year notes influence high-yield flows.
Risks and Important Notes
Technical levels in HYG can fail abruptly due to unforeseen events like sudden inflation data, geopolitical tensions, or policy shifts under the current administration. Volume anomalies or news-driven gaps often invalidate setups, reminding retail traders that past patterns do not predict future results.
This analysis serves educational purposes only; always incorporate fundamental context, risk management via stops, and personal due diligence. Position sizing should match risk tolerance, avoiding overexposure in volatile fixed-income markets.
For deeper insights, explore related analyses on investment-grade bond ETFs like LQD or junk bond peers such as JNK, and monitor our coverage of equity-bond correlations via SPY technical updates.