

HYG ETF analysis with latest price trends, technical signals, analyst views, risks, and outlook for income-focused investors.
Data as of April 20, 2026, 1:43 PM PKT — last market close data used.
Introduction
The HYG ETF is the iShares iBoxx $ High Yield Corporate Bond ETF. It gives investors exposure to U.S. dollar-denominated, below-investment-grade corporate bonds. In simple terms, it is a high-yield bond fund, not a stock fund, so its performance is shaped more by credit risk, interest rates, and bond spreads than by tech earnings.
Investors are watching the HYG ETF now because high-yield debt has become more sensitive to rate expectations and credit conditions. When markets expect easier monetary policy or stable corporate profits, high-yield bonds often attract more interest. In weaker credit environments, the fund can face pressure even when stocks are rising.
Latest ETF Price & Trend
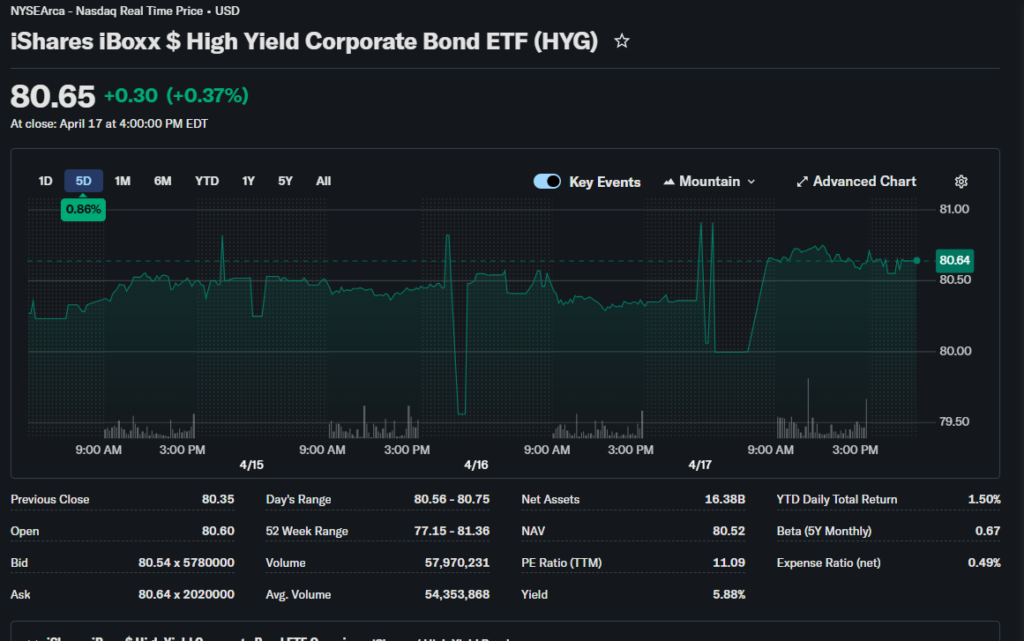
The latest reported HYG ETF price is about $80.60 to $80.65, based on the most recent market close data available. On April 19, 2026, it traded between $80.56 and $80.76, which shows very tight daily movement. The fund’s recent 24-hour move was small, and the short-term trend looks mostly sideways rather than strongly bullish or bearish.
Over the last month, HYG has shown only a modest gain, with sources indicating roughly flat to slightly higher performance depending on the data window. Over three months, the broader trend appears steadier, with positive total-return behavior rather than sharp momentum. The 52-week range was not fully available in the sources reviewed, so it should not be estimated. Based on the available price action, the HYG ETF looks stable, which usually suggests investors are waiting for clearer credit or rate signals.

Technical Analysis
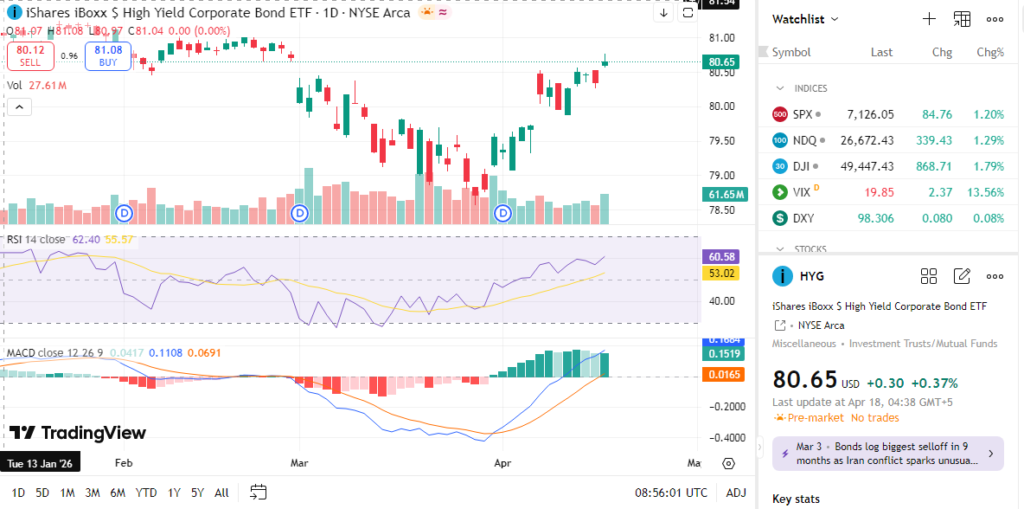
The HYG ETF technical analysis points to a market that is calm, not overheated. A support level is the price area where buyers often step in, while resistance is the area where sellers often appear. Using the recent range near $80.56 to $80.76, HYG is trading close to short-term support and resistance, so a breakout would need stronger volume.
The RSI, or Relative Strength Index, measures whether an asset is overbought or oversold. One source placed HYG’s RSI near the neutral zone, while another noted a possible move out of oversold conditions earlier in April. That suggests the fund is not stretched in either direction right now.
The MACD, or Moving Average Convergence Divergence, helps show whether momentum is improving or weakening. One technical source said HYG’s MACD turned positive in early April 2026, which is a mildly bullish sign. The 200-day moving average was listed around 77.80, while the 50-day average was not fully confirmed in the sources available. Because the price is above the 200-day average, the longer trend remains constructive.
A golden cross happens when a shorter moving average rises above a longer one, while a death cross is the opposite. I could not verify a current golden cross or death cross from the available sources, so that should be treated as unconfirmed. Trading volume data was also incomplete, but the narrow daily range suggests participation has been orderly rather than aggressive.

Analyst Ratings & Targets
Traditional analyst coverage for the HYG ETF is limited, because this is a bond ETF rather than an operating company. That means there are no normal Buy, Hold, or Sell earnings-rating tables like you would see for a stock. In practice, investors watch fund flows, credit spreads, and yield rather than analyst price targets.
Because HYG does not have company earnings in the usual sense, the phrase HYG ETF earnings is not directly applicable. Instead, investors focus on distribution income, yield to maturity, and the quality of the bonds in the portfolio. Morningstar showed an average credit rating around B+ and a yield to maturity around 7.20%, which helps explain the income appeal.
For target-style analysis, the most useful signals are portfolio yield, duration, and market price relative to NAV. Those measures matter more than Wall Street-style targets. Overall, sentiment appears neutral to cautiously constructive, not euphoric.
Insider Activity
Insider activity is not a meaningful metric for the HYG ETF in the same way it is for a corporation. ETFs do not have company executives buying or selling shares based on internal business forecasts. Instead, investor behavior shows up through fund flows and trading volumes.
Because of that structure, there is no true insider buying or insider selling story here. Large trades in HYG usually reflect portfolio allocation changes by institutions, not management confidence. That means the usual insider-signal framework should not be used for this fund.
Valuation Analysis
Valuation metrics like trailing P/E, forward P/E, and price-to-sales do not apply to the HYG ETF in a useful way, because the fund holds bonds, not operating businesses. Revenue growth and EPS growth also do not fit the normal ETF structure. Instead, the right valuation lens is yield, credit quality, and price versus NAV.
The most relevant figures available are the portfolio’s average credit rating of B+, yield to maturity near 7.20%, and reported dividend yield around 5.2% to 5.67%. Morningstar also listed weighted coupon data near 6.68% and weighted price near 99.03 for the portfolio. These figures suggest HYG is best viewed as an income instrument with credit risk, not a growth asset.
Relative to stock benchmarks such as Microsoft or Zoom, HYG is not comparable on earnings multiples or sales ratios. It is more appropriate to compare it with other high-yield bond funds or with investment-grade bond ETFs. On that basis, the fund appears fairly valued for the income and credit risk it carries.
Recent Earnings & Catalysts
The HYG ETF earnings term is misleading, because the fund does not report earnings like a company. Its performance is driven by bond income, credit spreads, default expectations, and interest-rate expectations. So the real catalyst is not earnings season, but the direction of the credit market.
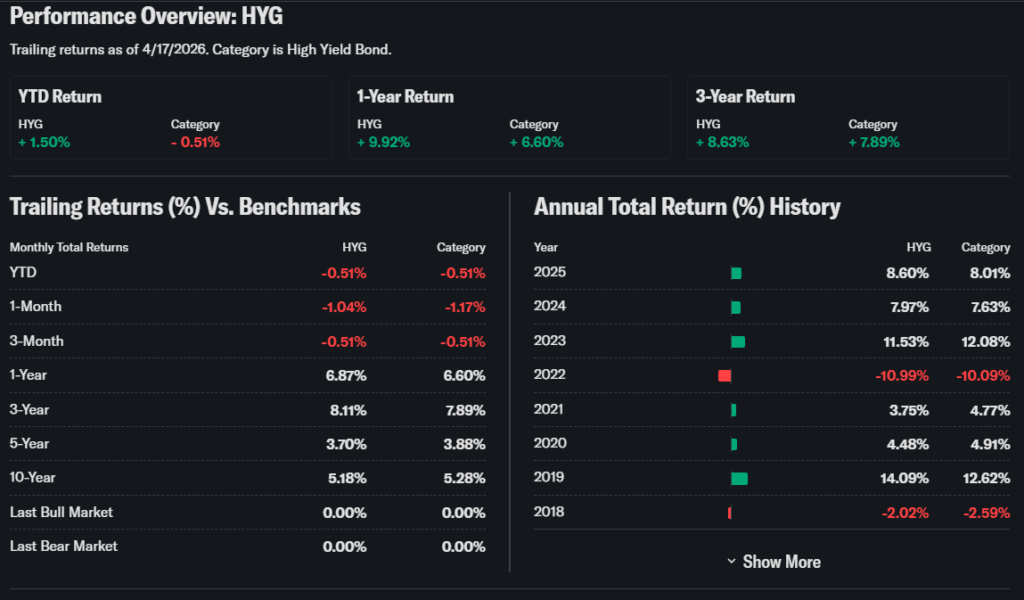
Recent performance data shows HYG produced positive total returns in 2025 and continued to trade steadily into 2026. iShares reported a 2025 total return of 8.56% and a 2026 year-to-date total return of 6.87% as of the latest fund page update. That suggests the ETF has benefited from a relatively supportive credit backdrop.
Key catalysts for HYG include Federal Reserve policy expectations, changes in default risk, and investor demand for yield. If economic data softens without a credit shock, high-yield bonds can remain supported. If recession risk rises sharply, spreads may widen and pressure the fund.
Bullish Case
The bullish case for the HYG ETF starts with income. The fund offers a yield profile that is attractive compared with many cash-like alternatives, and that can appeal to investors who want steady distributions. A B+ average credit rating also suggests the portfolio is below investment grade, but not concentrated in the weakest credits.
Another positive factor is that the fund has shown steady returns rather than extreme volatility. Recent market price and total return data indicate the ETF has held up reasonably well. If credit conditions stay stable, HYG can continue to serve as a yield-focused allocation.
Bearish Case
The main risk is credit deterioration. Because HYG owns lower-rated corporate bonds, defaults or widening spreads can hurt performance quickly. If the economy weakens, the fund may fall even when Treasury bonds rise.
A second risk is interest-rate pressure. Higher rates can reduce bond prices, especially when investors demand better yields elsewhere. There is also spread risk, meaning investors may require more compensation for holding risky debt during uncertain periods.
Market Sentiment & Investor Psychology
The available sources suggest sentiment is neutral to mildly optimistic. HYG is not showing panic selling, but it also is not showing a strong breakout pattern. The price is stable, and the technical signals are improving without being extreme.
Short-interest data is not typically the best sentiment gauge for a bond ETF. Institutional ownership matters more, since large funds often use HYG for tactical income exposure. Retail investors usually approach it as a yield product, not a high-conviction growth trade.

Short-Term Outlook
In the next few days or weeks, the HYG ETF forecast looks range-bound unless rates or credit spreads move sharply. The current trend is near-neutral, and the technical picture is moderately supportive. That means the ETF may continue moving in a narrow band unless new macro data changes expectations.
For short-term traders, the key is watching support near the recent lows and resistance near the recent highs. A stronger move would likely need higher volume and a clearer shift in bond-market sentiment. Until then, HYG looks more like a steady income holding than a momentum trade.
Medium to Long-Term Outlook
Over the next 6 to 24 months, the HYG ETF should be judged by credit stability, not headline stock-market excitement. If default rates stay manageable and yields remain attractive, the fund can continue to work well for income-focused portfolios. Its role is defensive income with some credit risk, not capital growth.
For long-term investors, the fund is best viewed as a hold or selective accumulate candidate during calm credit periods. It makes less sense if recession risk is rising fast or if investors need principal stability. The strategic advantage is simple: HYG gives broad high-yield bond exposure in one liquid ETF.
FAQ
Is HYG ETF a buy right now?
The HYG ETF may be attractive for income seekers, but it is not a clear aggressive buy. It looks more suitable for investors who accept credit risk in exchange for yield.
What is the price target for HYG ETF?
There is no standard equity-style price target for HYG. The better focus is on yield, NAV behavior, and credit conditions.
What are the major risks for HYG ETF?
The main risks are defaults, widening credit spreads, and higher rates. These risks can reduce bond prices and hurt returns.
Is HYG ETF forecast positive?
The near-term HYG ETF forecast is modestly positive to neutral. That view depends on stable credit markets and no sharp rise in recession fears.
What does HYG technical analysis show?
The latest technical picture is mixed but improving. RSI looks neutral, MACD is mildly supportive, and the price is near a stable trading range.
Suggestions
- Compare with iShares iBoxx $ Investment Grade Corporate Bond ETF.
- See our high-yield bond ETF outlook.
- Read our fixed income valuation breakdown.
Conclusion
The HYG ETF looks like a reasonable income-focused holding, not a high-growth trade. The current picture supports a Hold rating for most investors, with selective accumulation only when credit conditions remain stable.
It offers attractive yield, steady trading behavior, and broad high-yield bond exposure. At the same time, credit risk and rate sensitivity remain real. That makes the fund suitable for balanced income portfolios, but not for investors who need safety above all else.
Disclaimer: This article is for informational purposes only and not financial advice.