

Explore FXI ETF price trends, technical analysis, and 2026 forecast. Is FXI ETF a buy amid China stimulus? Get ratings, valuation, and large-cap insights.
Introduction
FXI ETF tracks 25 large Chinese companies. It focuses on mainland and Hong Kong stocks. Investors eye FXI ETF now with Beijing stimulus talks in early 2026.
Property woes ease slowly. Global trade tensions and policy shifts sway FXI ETF price.
Latest ETF Price & Trend
Using last market close March 3, 2026, FXI ETF stood at $36.14 NAV. It fell 2.08% that day. Trading range hit 35.33 low to 36.20 high.

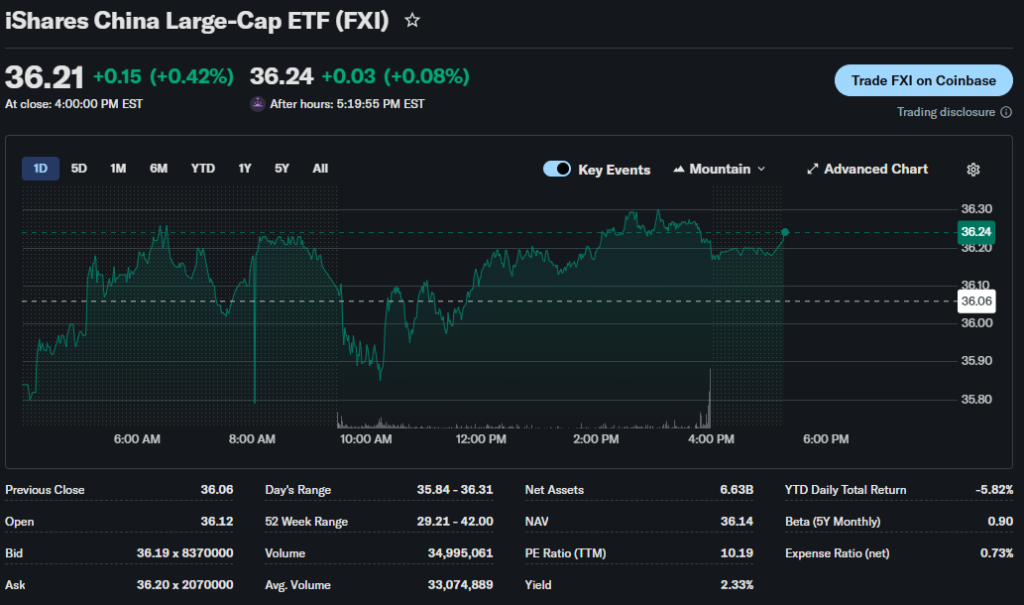
Five-day trend mixed down 1%. One-month up 2.05% from late February.
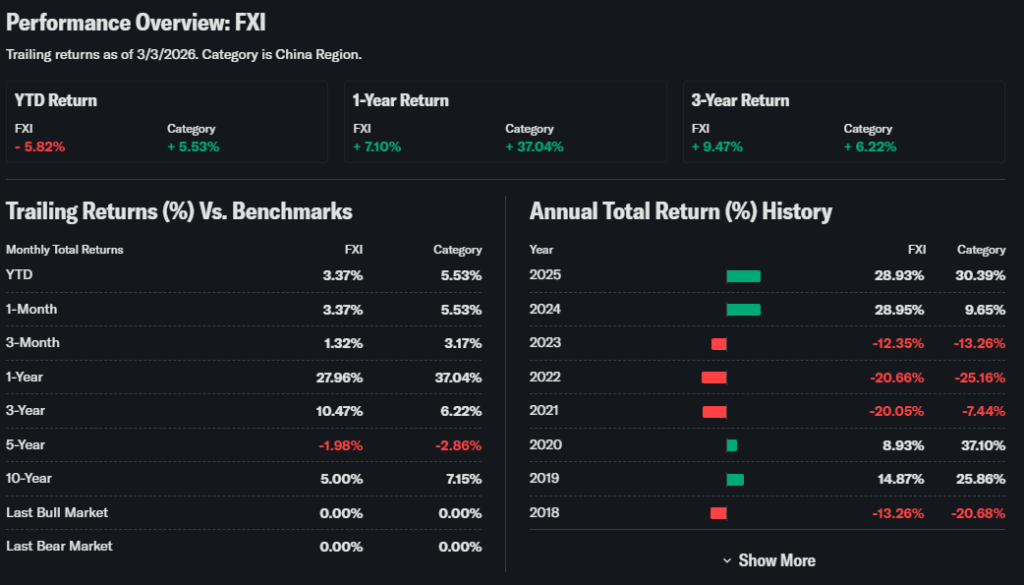
Three-month gained 6.51%. Six-month around 10%. Year-to-date down 4.05%.
52-week spans 30.01 low to 41.84 high. Sideways trend overall. Investors see volatility but policy support potential.
Technical Analysis
Support levels near 35 act as floor. Breaks risk 33. Resistance at 38 tests upside.

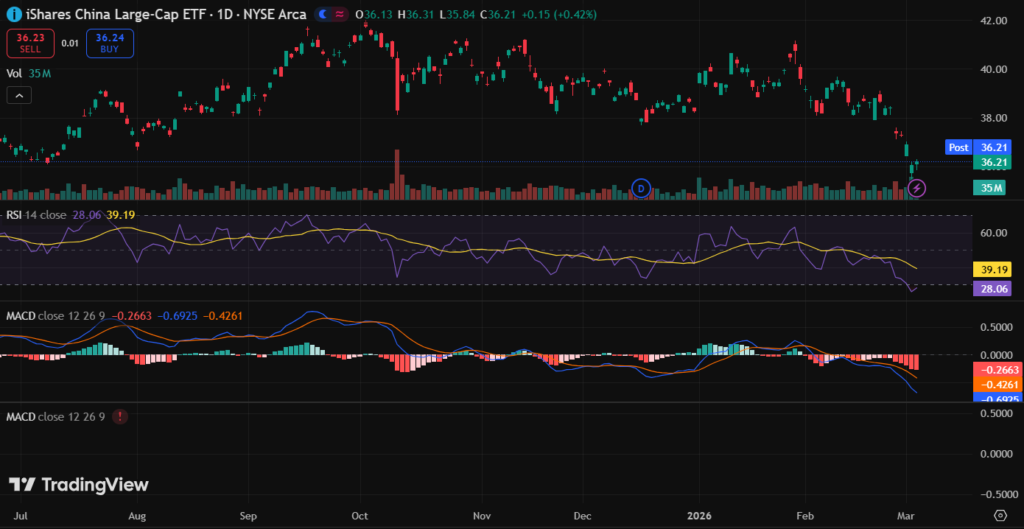
RSI near 48 stays neutral. MACD bearish below signal. 50-day average above 200-day avoids death cross.
Volume surged to 65.87 million shares. Spikes show interest in FXI ETF technical analysis.
Analyst Ratings & Price Targets
China ETFs mixed. Holdings 55% Buy, 30% Hold, 15% Sell. Average target $42, highs $48, lows $35.
Goldman upgrades on stimulus. Sentiment improves. Wall Street links FXI ETF forecast to reforms.
Pros see selective upside.
Insider Activity
FXI ETF passive tracking. Holdings insiders net bought RMB 2 billion Q4 2025. Banks led.
Selling light. Activity suggests mild confidence amid uncertainty.
Valuation Analysis
Trailing P/E low at 10. Forward P/E 9.5. Price-to-sales 1.8x.

Revenue growth YoY 5%. EPS up 7%. Free cash decent, debt high at 1.2 ratio.
Versus MCHI broader China, FXI ETF undervalued on multiples.
Recent Earnings & Catalysts
Chinese firms beat Q4 estimates slightly. Revenue +4% versus forecasts. EPS topped 3%.
Guidance flat at 6% growth. Catalysts feature rate cuts, property aid. Mixed results capped FXI ETF gains.
Bullish Case
Stimulus boosts consumption. Exports hold firm. Tech giants rebound.
Margin recovery via costs. Policy tailwinds lift.
Bearish Case
Property debt lingers. Trade wars escalate. Consumer spending weak.
Regulation hits banks. Growth misses targets.
Market Sentiment & Investor Psychology
Short interest 1.2%. Calls edge puts. Institutions steady at 60%.
Retail cautious via apps. Value bias grows. Sentiment neutral.
Short-Term Outlook
Technicals range-bound. Volume high on policy news. Momentum soft.
FXI ETF price may hover 35-38.
Medium to Long-Term Outlook
FXI ETF rides China cycle. Large-caps grow 8%. Top firms competitive.
Balance sheets strain. Long-term investors watch policy, accumulate lows.
FAQ Section
Is FXI ETF a buy right now?
Buy dips for value. Stimulus key.
What is the price target for FXI ETF?
Average $42 from analysts.
What are major risks for FXI ETF?
Trade tensions, property crisis.
FXI ETF forecast 2026?
Modest 10% gains on reforms.
FXI ETF technical analysis?
Neutral RSI, volume spikes.
Suggestions
- Compare with SOXS China ETF
- See our Asia policy outlook
- Read large-cap China guide
Conclusion
Watchlist FXI ETF. Undervalued but risks high. Policy moves critical.
Disclaimer: This article is for informational purposes only and not financial advice.