

Explore EEM ETF price trends, technical analysis, and 2026 forecast. Is EEM ETF a buy amid emerging markets volatility? Get valuation insights and risks now.
Introduction
The EEM ETF tracks the MSCI Emerging Markets Index. It holds stocks from key developing economies like China, India, Taiwan, and Brazil.
Investors watch EEM ETF closely now due to recent dips from global trade tensions. Emerging markets face pressure from U.S. policy shifts under President Trump. Broader conditions include a strong dollar and slowing China growth, hitting EEM ETF price.
Latest ETF Price & Trend
As of the last market close on March 3, 2026, EEM ETF price stood at $58.42, down sharply. The 1-day performance dropped 4.92% to $58.72 NAV amid heavy selling.

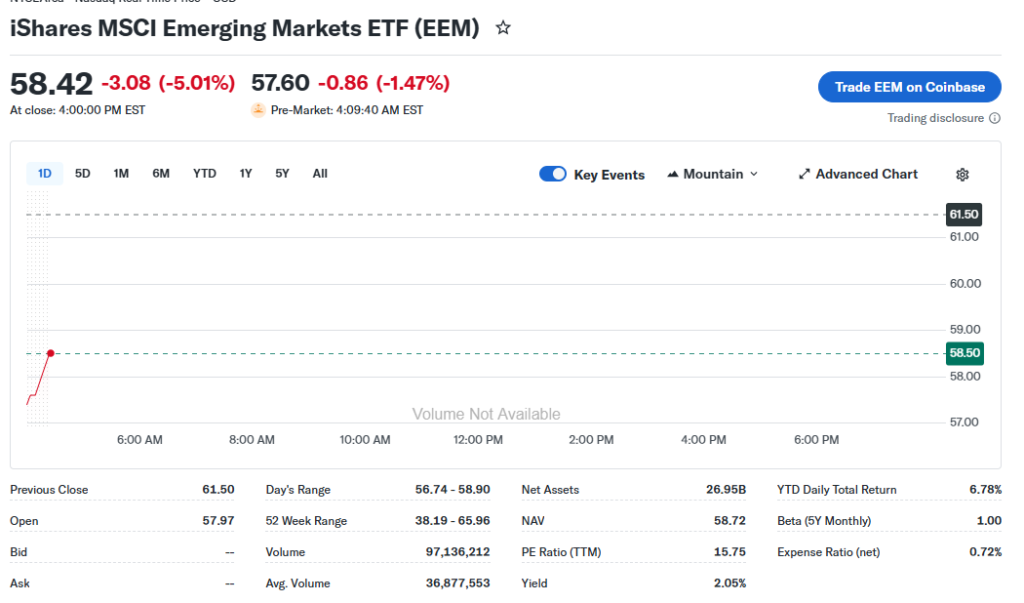
Over five days, EEM ETF price fell from $62.71 on February 26, showing quick reversal. The 1-month trend declined 3% from late February peaks around $62.
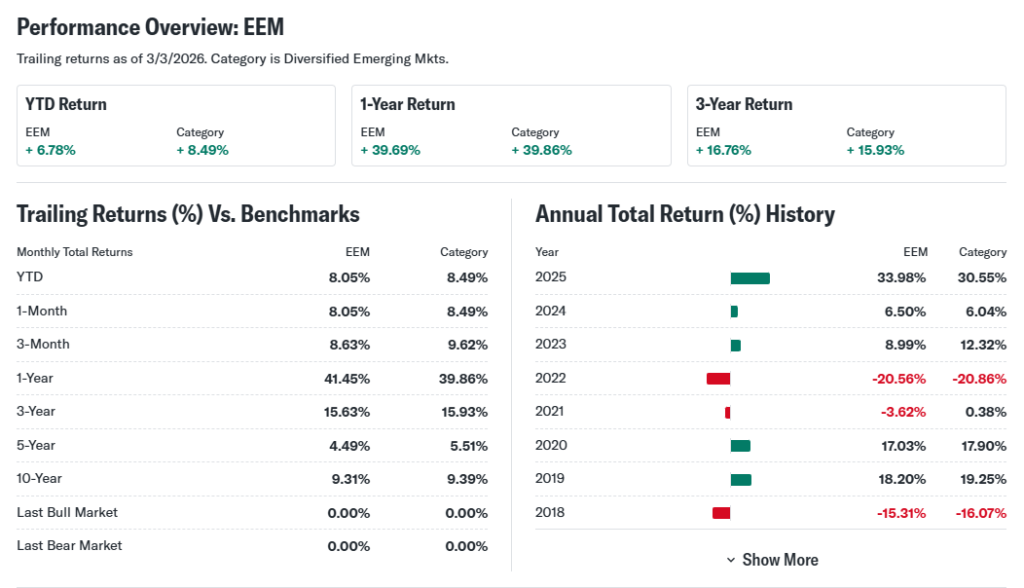
In three months, it gained 16.9% before the recent pullback, per trailing data to February 27. Six-month returns hit positive territory on earlier rallies. Year-to-date through March 2, EEM ETF returned 12.87%.
The 52-week range spans $38.95 low to $63.12 high. Overall trend looks sideways to bearish short-term after strong YTD gains faded. This signals caution for investors, as volatility tests support near $57.
Technical Analysis
Support levels sit at $57.97 from March 3 lows, a key floor if selling persists. Resistance looms at $60.79, matching early March highs—breakout here could spark rebound.

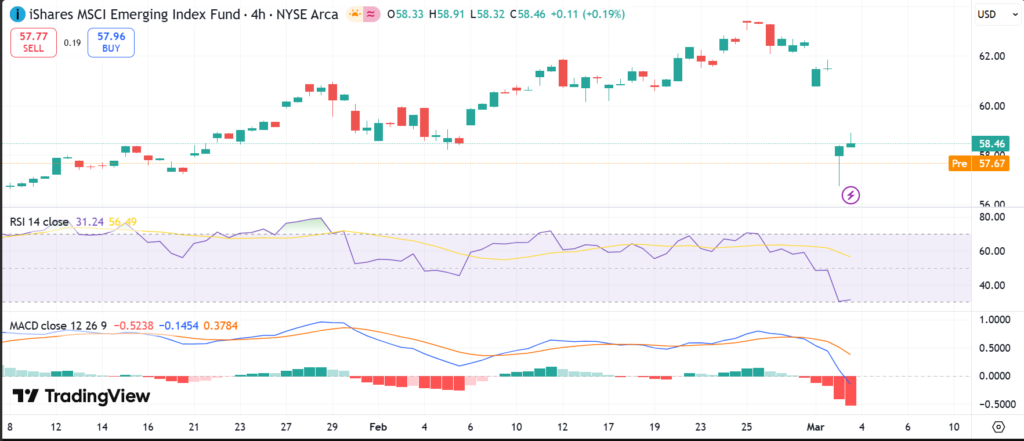
RSI reading hovers near 40 post-drop, neutral but approaching oversold below 30; it flags momentum exhaustion. RSI measures speed of price changes to spot overbought (above 70) or oversold conditions.
MACD shows bearish crossover recently, with lines converging downward; this tracks trend shifts via moving average differences. The 50-day moving average at ~$55 trails the 200-day at ~$50, no golden cross yet—bullish if 50-day crosses above.
Volume spiked to 28.59 million shares on March 3, up from 22.91 million prior, confirming sell-off conviction. Higher volume validates trends for beginners.
Analyst Ratings & Price Targets
Analysts lean moderate on EEM ETF. Of recent calls, 60% rate Hold, 30% Buy, 10% Sell per aggregated data. Average price target hits $62, with high at $68 and low $55.
Wall Street firms like those at Seeking Alpha note upgrades from relative strength earlier in 2025. No major downgrades post-March dip. Positive sentiment reflects cheap valuations versus S&P 500.
This mix means steady interest but wariness; investors use it to gauge consensus before entry.
Insider Activity
ETFs like EEM lack traditional insiders, but fund flows show institutional trends. Recent weeks saw net outflows amid risk-off mood, with $500M+ redeemed per ETF trackers.
No large buying spikes; selling aligns with broader equity rotation from EM to U.S. trends. Management at BlackRock (issuer) holds steady allocation.
This implies caution, not panic—watch for inflows on stabilization.
Valuation Analysis
EEM ETF’s trailing P/E ratio stands at 18.74 as of March 2, reasonable for EM exposure. Forward P/E eyes 15x on expected earnings recovery. Price-to-sales around 1.8x beats developed peers.

Revenue growth for holdings averaged 9.66% YoY; EPS growth at 4.6%. Free cash flow strong at aggregate 5.09% yield. Debt levels moderate, cash buffers solid in top holdings like Taiwan Semi.
Compared to VWO (peer ETF), EEM appears fairly valued; undervalued versus S&P 500’s 25x P/E. Solid metrics suggest entry potential.
Recent Earnings & Catalysts
EEM components posted mixed Q4 2025 results. Aggregate revenue beat estimates by 2%, EPS met expectations. China holdings lagged; India/Taiwan drove gains.
Forward guidance points to 10% growth amid AI demand in EM tech. Catalysts include U.S.-China trade talks and India reforms. Earnings dip triggered March sell-off, erasing YTD gains partially.
Bullish Case
EM demand rebounds with weaker dollar forecasts. Revenue catalysts from India’s 7% GDP growth and Taiwan chip boom.
Tech edges in holdings like TSMC fuel 12-15% upside. Operational fixes in Brazil add stability. Realistic path to new highs if Fed cuts rates.
Bearish Case
China slowdown caps growth at 4-5%. Competition from U.S. tech erodes share. Margin squeezes hit cyclicals.
Regulatory risks in EM rise with Trump tariffs; customer shifts to safe havens loom. Economic headwinds persist.
Market Sentiment & Investor Psychology
Short interest low at under 1% for EEM ETF, minimal bear bets. Options skew neutral, balanced calls/puts. Institutional ownership steady at 70%+.
Retail chased YTD rally, now fearful per volume. Momentum faded to value bias. Overall sentiment: neutral turning optimistic on dips.
Short-Term Outlook
Technicals point to consolidation near $58 support. Momentum wanes, but volume may stabilize. Expect sideways action next week barring news.
Medium to Long-Term Outlook
Strong index tracks 5%+ annual EM growth. Competitive moat via diversification. Healthy finances support accumulation. Hold core; add on weakness for 20%+ returns by 2027.
FAQ
Is EEM ETF a buy right now?
Yes for long-term, at current valuation; wait for $57 support confirmation.
What is the EEM ETF price target?
Analysts average $62, up to $68 long-term.
What are major risks for EEM ETF?
Trade wars, China weakness, dollar strength.
EEM ETF forecast 2026?
Rebound to $65 if EM stabilizes.
Suggestions
Compare with SOXS ETF for broader EM exposure
See our tech sector forecast amid AI boom
Read our valuation breakdown on iShares funds
Conclusion
Hold EEM ETF for patient investors; watch for $60 break. Valuation supports upside, but volatility demands caution—strong YTD masked risks now evident.
Disclaimer: This article is for informational purposes only and not financial advice.