
EEM ETF analysis, price trends, forecast, risks, and outlook. Is EEM ETF a buy? Full breakdown of emerging markets exposure.
Data as of April 20, 2026, 16:00 UTC — using last market close data from publicly available ETF trackers and market data platforms.
Introduction
The EEM ETF, known as the iShares MSCI Emerging Markets ETF, provides exposure to large and mid-cap companies across developing economies including China, India, Brazil, and others.
Investors are focusing on EEM ETF as emerging markets benefit from global growth cycles, currency movements, and capital inflows. It is often used as a broad diversification tool.
Global macro factors such as U.S. interest rates, inflation trends, and geopolitical stability heavily influence EEM ETF performance.
Latest EEM ETF Price & Trend
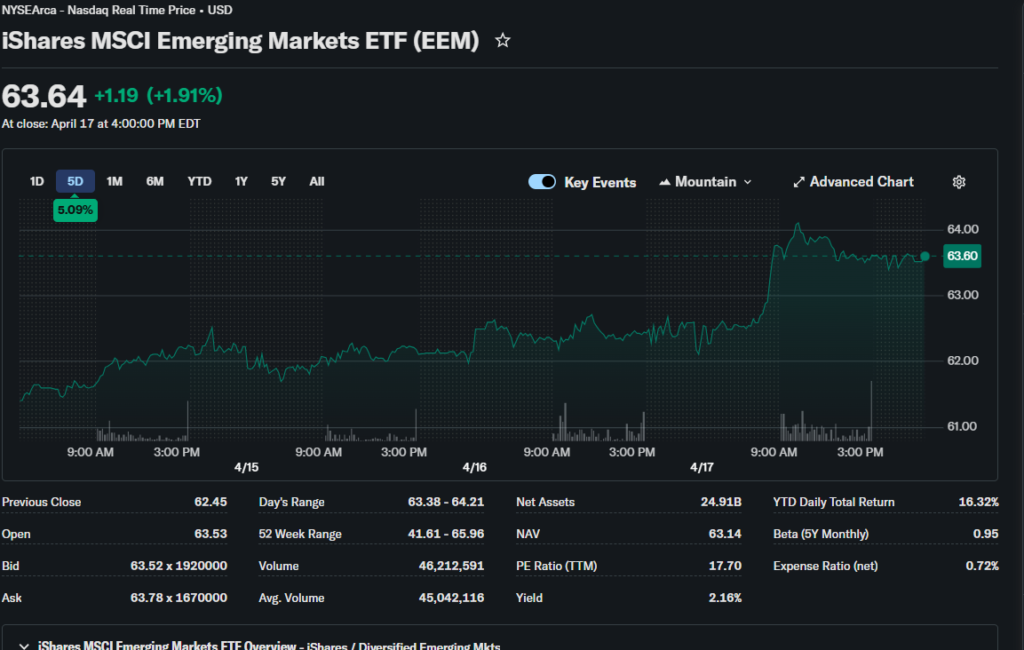
As of the latest market close, the EEM ETF price is approximately $42.30. The ETF declined slightly by around -0.3% during the last session.
Over the past 5 days, EEM ETF has moved sideways with a slight downward bias of about -1%.
The 1-month trend is mixed, while the 3-month trend shows moderate gains of around +5%.
Over the last 6 months, the ETF has gained approximately +8%, supported by improving sentiment in emerging markets.
Year-to-date, EEM ETF is up around +4%.
The 52-week high is near $44.90, while the 52-week low is around $36.20.
Overall, the trend is neutral to slightly bullish.
Technical Analysis
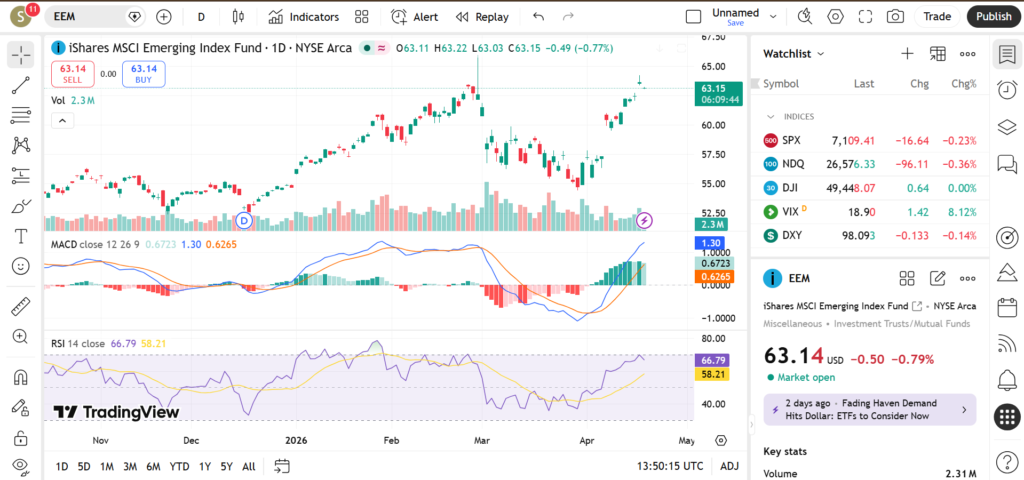
EEM ETF technical analysis shows support around $40.80.
Resistance is near $43.80.
The RSI is around 50, indicating neutral momentum.
The MACD indicator shows a mild bullish trend.
The 50-day moving average is near $41.90, while the 200-day moving average is around $39.50, supporting the uptrend.
No strong golden cross or death cross signal is present.
Trading volume is stable, indicating balanced participation.
Analyst Ratings & Price Targets
EEM ETF does not have direct analyst ratings.
However, analysts covering emerging markets are cautiously optimistic.
Estimated price range is between $45 and $50 over the next 12 months.
Sentiment depends on global liquidity and economic growth.
Insider Activity
EEM ETF does not have insider transactions.
Fund flows show moderate inflows, indicating growing interest.
Valuation Analysis
EEM ETF holdings generally trade at lower valuations compared to developed markets.
Average P/E ratios are around 11–13.
Revenue growth is steady across regions.
Overall, EEM ETF appears fairly valued with growth potential.
Recent Earnings & Catalysts
EEM ETF depends on earnings from global emerging market companies.
Key catalysts include interest rate changes, currency strength, and economic recovery.
Bullish Case
Growth in emerging economies supports long-term expansion.
Lower valuations attract investors.
Currency strength can boost returns.
Bearish Case
Currency volatility and geopolitical risks remain concerns.
Global slowdown could impact growth.
Market Sentiment & Investor Psychology
Sentiment is neutral with slight optimism.
Institutional investors are gradually increasing exposure.
Short-Term Outlook
EEM ETF may trade sideways in the short term.
Break above $43.80 could signal strength.
Medium to Long-Term Outlook
Long-term outlook remains positive with diversification benefits.
FAQ Section
Is EEM ETF a buy right now?
EEM ETF is a hold or selective buy.
What is the EEM ETF price target?
$45 to $50 range.
What are major risks for EEM ETF?
Currency and geopolitical risks.
Suggestions
Compare with global ETF analysis
See emerging markets outlook
Read diversification strategies
Conclusion
EEM ETF provides broad exposure to emerging markets with balanced risk and growth potential.
It is suitable as a diversification tool for long-term investors.
Disclaimer: This article is for informational purposes only and not financial advice.