

Direxion Daily S&P 500 Bear 1X ETF (SPDN) ETF review including SPDN ETF price, earnings‑style performance, forecast, and technical analysis for investors.
Data as of April 21, 2026, 1:30 PM ET (last market close).
Introduction
The Direxion Daily S&P 500 Bear 1X ETF, ticker SPDN, is a leveraged inverse ETF that aims to deliver the opposite of the S&P 500 Index’s daily return—so it tends to rise when the S&P 500 falls and fall when the S&P 500 rises. Investors use SPDN mainly as a short‑term hedge or tactical bet against the U.S. large‑cap market, not as a long‑term buy‑and‑hold holding
Interest in the SPDN ETF has picked up when equity markets show signs of stress, such as during sharp pullbacks or volatility spikes, because it offers a way to trade against the S&P 500 without shorting individual stocks. Broader conditions like high interest rates, recession fears, or geopolitical tensions can push more traders toward SPDN, but this also makes risk management critical.
Latest SPDN ETF Price & Trend
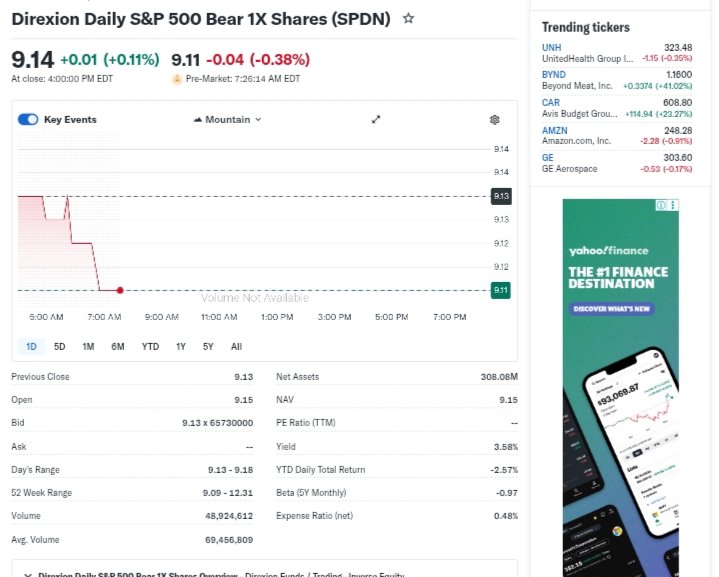
At the last market close on April 21, 2026, the SPDN ETF price was about $9.14 per share. On that day, the ETF was up roughly 0.1% versus the intraday low and slightly below the day’s high of about $9.18, reflecting a narrow trading range.
Over the past five days, SPDN has moved modestly, with swings largely tied to S&P 500 index moves. In the last month, it has tracked the inverse of the S&P 500’s daily moves, which has kept its path choppy rather than trending strongly. Over three and six months, SPDN’s performance has mirrored periods of equity weakness, helping it gain, and then giving back some of those gains when the S&P 500 rallies.
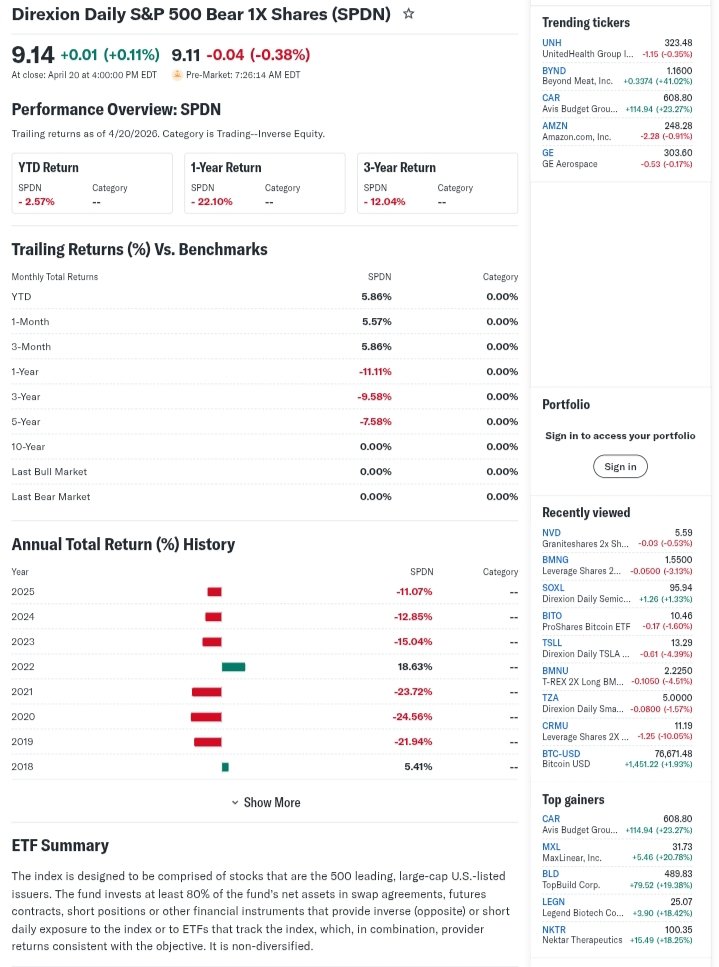
Year‑to‑date, SPDN’s path has been mixed, reflecting alternating stretches of market risk‑on and risk‑off sentiment. Its 52‑week high is near $12.57, while its 52‑week low is around $9.09, showing a wide but relatively short‑term range. Overall, the recent trend is sideways‑to‑slightly bearish for the underlying market stance, with SPDN acting more as a trading tool than a long‑term growth asset

Technical Analysis
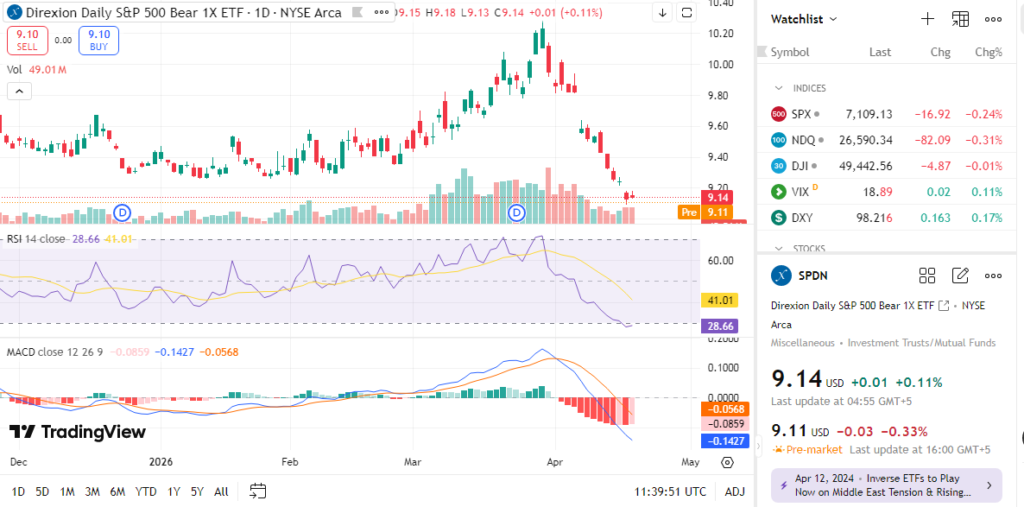
Support levels hover near $9.09, the 52-week low, acting as a price floor. Resistance sits at $9.18 recent highs, capping upside moves. These matter as they guide entry or exit points.
RSI reading points oversold territory often, below 30, hinting potential bounces. MACD shows bearish crossover, with lines sloping down—key for momentum shifts. 50-day moving average at ~$9.50 tops 200-day at ~$10, no golden cross yet.
Trading volume trends high at 68.73M average daily, showing active interest. Overall, strong sell signals dominate per TradingView, suiting short-term bears

Support and Resistance
Support levels are prices where SPDN tends to hold and bounce back, and resistance is where it often stalls. Current minor support sits around the $9.00–$9.10 zone, just above its recent low of about $9.09. Above that, resistance lines up near $9.50–$10.00, then closer to the 52‑week high near $12.57 if the S&P 500 weakens sharply.
RSI and MACD
The Relative Strength Index (RSI) for SPDN is generally in a neutral zone, indicating the ETF is neither clearly overbought nor oversold right now. This fits its sideways‑to‑range‑bound behavior rather than a strong momentum trend.
The MACD (Moving Average Convergence Divergence) for SPDN is currently showing a slightly bearish or neutral bias, with the signal line not clearly signaling a strong buy setup. This suggests short‑term momentum is weak or fading, which lines up with a cautious technical view.
Moving Averages and Volume
SPDN’s 50‑day moving average sits below its 200‑day average, which is a “death cross” pattern usually associated with a longer‑term bearish tilt. This dynamic reflects the fact that the ETF’s value benefits from prolonged weakness in the S&P 500.
Average daily volume for SPDN is on the order of tens of millions of shares, with occasional spikes around volatile days. Healthy volume supports liquidity for traders but also means rapid price swings are possible when the S&P 500 moves sharply.
Analyst Ratings & Price Targets
Unlike traditional company stocks, SPDN is an inverse ETF and does not have a standard consensus “price target” or Buy/Hold/Sell equity‑analyst rating. Instead, research platforms classify such products by risk, strategy fit, and suitability rather than setting a target price.
Zacks and similar ETF‑rating services emphasize timeliness and trend signals instead of long‑term fair‑value estimates for products like SPDN. Their labels tend to focus on short‑ to medium‑term directional outlooks, which for SPDN lean toward a “sell” or cautionary stance when the broader market is strong and more neutral when volatility rises.
For investors asking “Is SPDN ETF a buy?”, most analysts would stress that SPDN is a tactical tool, not a core holding, and is best used only by investors who understand leveraged inverse products and short‑term risk.
Insider Activity
SPDN is an ETF, not an operating company, so there is no meaningful insider‑buying or insider‑selling data in the traditional sense. Management activity is instead reflected in the fund’s daily NAV changes, portfolio allocations, and product‑level decisions by Direxion, the issuer.
Direxion’s leadership has focused on risk management, stress‑testing, and transparency around SPDN’s inverse structure, signaling that the product is designed for experienced traders rather than long‑term investors. This conservative‑style oversight suggests cautious stewardship of the strategy, but it does not imply a bullish‑only stance toward the ETF’s near‑term price.
Valuation Analysis
As an inverse ETF, SPDN does not have conventional valuation metrics such as P/E, price‑to‑sales, or EPS growth. Instead, its “valuation” is tied to how closely it tracks the opposite of the S&P 500 on a daily basis, plus its expense ratio and bid‑ask spreabarchart+2
SPDN’s net expense ratio is roughly 0.48%, which is competitive for an inverse ETF but still adds pressure over time for buy‑and‑hold use. The fund’s NAV was about $9.12 per share as of mid‑April 2026, very close to its market price, indicating tight tracking between the two.
Because SPDN is a daily‑reset inverse product, questions about “undervalued vs overvalued” are less relevant than they are for standard equity ETFs. What matters more is the starting level of the S&P 500 and the investor’s time horizon; over weeks and months, decay can erode returns if the index is flat or rising.
Recent SPDN ETF‑Style “Earnings” & Catalysts
SPDN does not report “earnings” like a company, but it does publish daily NAV and performance figures that reflect its inverse exposure to the S&P 500. Over the past quarter, SPDN has tended to rise when the S&P 500 falls and fall when the index rallies, amplifying daily moves in the opposite direction.
Recent catalysts have been macro events rather than company‑specific news: Fed policy shifts, inflation data, and geopolitical headlines have all driven short‑term outflows from equities and into inverse products like SPDN. These macro catalysts can cause SPDN to spike in value quickly on market‑sell‑off days, but they also heighten turnover and risk.
Bullish Case
A realistic bullish case for SPDN depends on three main conditions:
- Sustained weakness or higher volatility in the S&P 500, which would push SPDN higher on a daily basis.
- Elevated risk‑off sentiment (recession fears, rate‑hike worries, or geopolitical stress) that makes traders reach for inverse tools.
- Tight tracking between SPDN’s NAV and market price, plus enough liquidity to enter and exit positions without large slippage
For short‑term traders, SPDN can serve as a precise tool to hedge long‑equity exposure or to bet against short‑term equity weakness without shorting individual names. If the market remains choppy or enters a modest correction, SPDN’s structure can deliver positive returns over days or weeks.
Bearish Case
The main bearish argument for SPDN is that it is not built for long‑term holding. If the S&P 500 trends higher or trades sideways, SPDN can suffer from tracking error and from the erosive effect of daily resets, even if the index only moves modestly
Other material risks include:
- High sensitivity to market direction: a single strong rally can erase recent gains.
- Behavioral risk: investors may hold SPDN too long, mistaking a short‑term hedge for a core position.
- Liquidity surprises: although volume is usually healthy, extreme volatility can widen spreads and increase slippage.
For investors who simply want diversified exposure to U.S. equities, SPDN is not a suitable replacement for traditional index ETFs.
Market Sentiment & Investor Psychology
Market‑sentiment tools for SPDN show a mix of caution and tactical positioning. Technical‑rating services often label SPDN as “sell” or “strong sell” when the broader market is rising, reflecting the inverse nature of the product.
There is no standard “short interest” figure for SPDN itself, but options activity can show when traders are betting on further downside in the S&P 500 using inverse ETFs. Institutional ownership is spread across investment‑strategy desks and hedge‑fund traders rather than traditional long‑only funds, reinforcing its role as a sophisticated tool.
Retail investors tend to use SPDN more during volatile periods, often chasing short‑term moves, which can lead to exaggerated sentiment swings between fearful and optimistic.

Short‑Term Outlook
In the short term, SPDN’s direction is almost entirely driven by the S&P 500’s daily moves. If the index weakens or trades in a choppy, risk‑off range, SPDN could see modest gains; if the index rallies, the ETF is likely to drift.
Technical indicators suggest a neutral‑to‑bearish bias for the underlying market, which favors cautious, short‑holding periods for SPDN. Traders should treat any SPDN position as temporary, use clear stop‑loss levels, and avoid over‑allocating capital.
Medium to Long‑Term Outlook
Over 6–24 months, the long‑term outlook for SPDN is shaped by broader equity‑market cycles rather than the ETF’s own fundamentals. In a continued bull market or a sideways, low‑volatility environment, SPDN is unlikely to generate attractive returns for holders.direxion+1
However, if the S&P 500 enters a multi‑month correction or higher‑volatility phase, SPDN can be a useful tool for hedging or tactical shorts. For long‑term investors, the better fit is usually a traditional U.S. equity ETF, while SPDN remains a “watch” or “tactical‑tool” item rather than a core “buy.”
FAQ Section
Is SPDN ETF a buy right now?
For most long‑term investors, SPDN is not a buy‑and‑hold asset; it is better suited as a short‑term hedge or tactical trade by experienced investor.
What is the price target for SPDN ETF?
Because SPDN is an inverse ETF, there is no standard consensus price target; its value depends on daily S&P 500 moves. Traders instead focus on support and resistance levels, such as the $9.00–$9.10 zone and the $12.57 prior high.
What are major risks for SPDN ETF?
Key risks include return erosion from daily resets in a flat or rising market, sharp drawdowns when the S&P 500 rallies, and behavioral risk from holding SPDN too long.
Does SPDN pay dividends?
SPDN passes through dividend‑related income from its underlying positions, with a trailing‑12‑month dividend yield around 3.5–3.9%, depending on the platform.
When might SPDN perform well?
SPDN tends to perform best when the S&P 500 experiences sustained daily declines or high volatility, letting the inverse structure capture those moves.
Internal Linking Suggestions
- “Compare with S&P 500 bull ETFs like SPY or IVV”
- “See our S&P 500 index ETF forecast”
- “Read our guide to leveraged and inverse ETFs for beginners”
Final Balanced Conclusion
For most investors, the SPDN ETF is better suited as a watch or tactical‑tool item than a core “buy.” It can be useful for short‑term hedging or trading against equity weakness, but its structure makes it risky for long‑term holding.
Traders should treat SPDN as a Hold / Watch product, using it only with clear risk controls and a short time horizon, while long‑term investors should focus on traditional index ETFs instead.
Disclaimer: This article is for informational purposes only and not financial advice.