

Explore COMP stock price, earnings, technical analysis, analyst ratings, valuation, and forecast. Is Compass stock a buy? Get balanced insights for investors as of March 2026.
Introduction
Compass Inc. (COMP stock) runs a leading online real estate platform. It offers tools for agents to manage clients, market properties, and handle operations. The company serves brokers across the U.S. with software and services.
Investors watch COMP stock closely now due to its recent merger with Anywhere Real Estate. This deal boosts scale in a tough housing market. Broader conditions like high interest rates slow home sales, but Compass gains market share.
Real estate tech faces headwinds from economic uncertainty. Yet, Compass shows profitability gains. This draws attention to COMP stock price trends.
Latest Stock Price & Trend
COMP stock closed at $9.75 on February 27, 2026, down 2.50% for the day. Volume hit 27 million shares, above the average of 19 million. Day’s range was $9.50 to $10.14.
Over five days, COMP stock fell about 5%, reflecting market pullback. In the past month, it dropped 8% amid housing sector worries. Three-month performance shows a 10% decline as rates stayed high.
Six-month trend is mixed, down 2% with volatility. Year-to-date in 2026, COMP stock lost 15% from January highs. The 52-week range spans $5.66 low to $13.96 high.
Overall, the trend leans bearish short-term but sideways longer-term. Investors see caution signals from slowing transactions, yet merger potential offers support.
Technical Analysis
Support levels sit near $9.00 and $8.50, key floors where buyers stepped in recently. These matter as they signal potential bounce points if selling eases.


Resistance looms at $10.50 and $12.00, past peaks blocking upside. RSI reads around 40, neutral but nearing oversold below 30—watch for reversal if it dips. RSI gauges momentum; below 30 hints undervalued, above 70 overbought.
MACD shows bearish crossover, with signal line below zero—indicating weakening momentum. The 50-day moving average at $10.20 tops the 200-day at $9.80, no golden cross yet. Moving averages smooth trends; 50-day crossing above 200-day signals bull shift.
Trading volume trends higher on down days, suggesting distribution. This warns of caution for bulls.
Analyst Ratings & Price Targets
Ten analysts rate COMP stock Strong Buy overall. Breakdown: 8 Buy, 2 Hold, 0 Sell. Average price target is $12.20, implying 25% upside from $9.75. High target $13.00, low $7.00.
Recent upgrades from firms like UBS cite merger synergies. No major downgrades lately. Wall Street sees value in Compass growth post-Anywhere deal.
Analyst sentiment leans positive, signaling confidence in execution. Investors use this as a gauge, but pair with own research.
Insider Activity
CEO Robert Reffkin added over 2.3 million shares via exempt transactions on February 4, 2026. No major sales reported recently. Other insiders like Scott Wahlers received awards.
Trends show net buying, implying management confidence. Large exempt buys often signal alignment with shareholders. Earlier gifts were minor.
This activity suggests insiders bet on upside, especially post-merger. Watch for patterns over quarters.
Valuation Analysis
Trailing P/E is negative at -88.64 due to past losses, but forward P/E around 53 reflects expected profits. Price-to-sales ratio nears 0.8, low for tech peers.

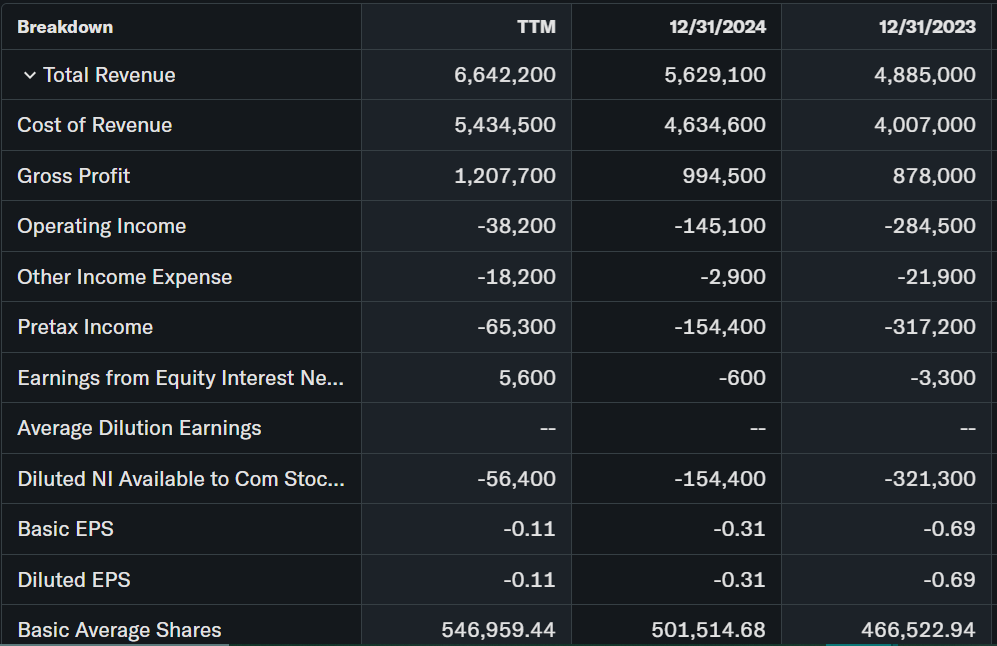

Revenue grew 24% YoY to $6.64 billion TTM. EPS improved to -0.10. Free cash flow turned positive, with Q3 2025 at $75.5 million operating cash. Debt minimal, cash at $170 million.
Compared to Zillow (higher P/S) or Redfin (similar losses), COMP appears undervalued on growth. Fairly valued overall, with merger upside.
Recent Earnings & Catalysts
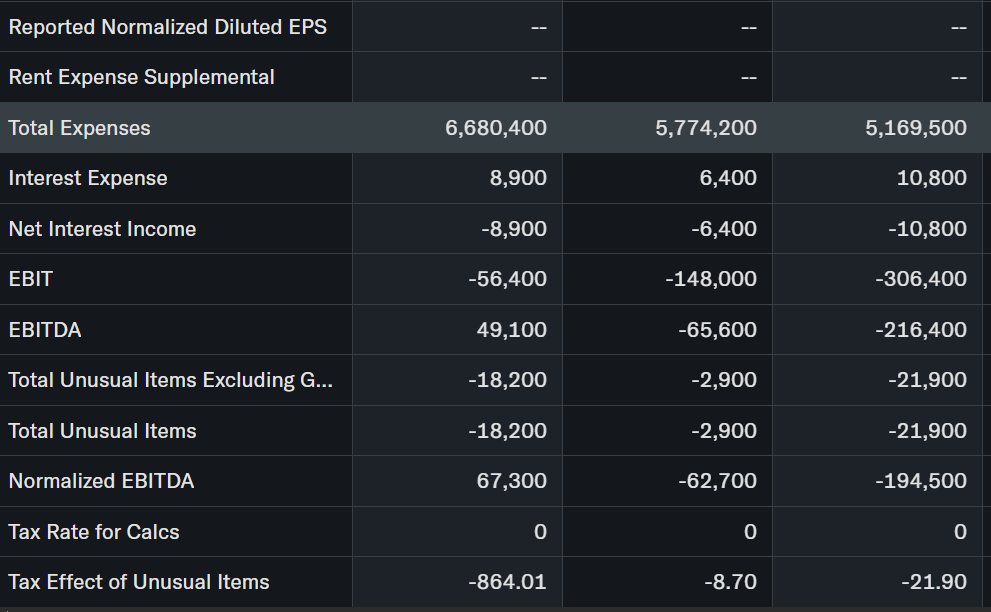
Q4 2025 revenue hit $1.70 billion, beating estimates despite market miss on volume. EPS -0.07 topped -0.06 forecast. Adjusted EBITDA record $58 million. Stock dipped 0.03% post-earnings.
Guidance: Q1 2026 revenue $2.55-2.75 billion, EBITDA $15-35 million. Catalysts include Anywhere merger (closed Jan 2026, $250M Year 1 synergies), Rocket/Redfin leads partnership, AI tools.
Earnings drove stability; merger integration lifts outlook.
Bullish Case
Revenue catalysts from merger scale and 5.6% market share. Agent adds hit records at 830 in Q4.
Tech edges like AI automation cut costs $20M yearly. Ancillary services (title, mortgage) boost margins to 11%. Housing recovery aids demand.
Operational gains: 97% retention, M&A pipeline strong.
Bearish Case
Competition from Zillow, Redfin pressures fees. High rates slow transactions 2% market-wide.
Margin squeeze if synergies lag; Q1 cash flow negative from deal costs. Regulatory merger risks linger. Economic slowdown hits luxury focus.
Market Sentiment & Investor Psychology
Short interest data limited, but institutional ownership high: Vanguard 74M shares, FMR 69M. Up 5% QoQ.
Options show balanced calls/puts. Retail chases momentum dips. Sentiment neutral, shifting optimistic on merger.
Short-Term Outlook
Technicals point to support test at $9.00. Volume spikes on dips signal watch. Momentum bearish, but RSI could rebound. Expect sideways action unless housing data improves.
Medium to Long-Term Outlook
Strong business model post-merger, industry growth 5-7% annually. Competitive tech moat, healthy cash. Hold for long-term; accumulate on weakness if synergies hit. Risks: recession, competition.
FAQ Section
Is COMP stock a buy right now?
Strong Buy rating, but wait for $9 support. Merger value emerging.
What is the COMP stock price target?
Average $12.20, 25% upside. High $13.00.
What are major risks for COMP stock?
High rates, competition, integration delays.
COMP stock forecast?
Positive medium-term on synergies, housing rebound.
COMP technical analysis key levels?
Support $9/$8.50, resistance $10.50. RSI neutral.
Suggestions
- Compare with Opendoor stock analysis
- See Redfin stock forecast
- Read real estate tech valuation breakdown
Final Balanced Conclusion
Hold COMP stock. Merger synergies and profitability build case, but short-term housing weakness warrants caution. Watch Q1 earnings for confirmation.
Disclaimer: This article is for informational purposes only and not financial advice.