

T-REX 2X Long BMNR Daily Target ETF (BMNU) Technical Analysis
The T-REX 2X Long BMNR Daily Target ETF (BMNU) is a leveraged ETF designed to deliver 200% of the daily performance of the underlying BMNR ETF, focusing on amplified exposure in its targeted sector. Traders are watching BMNU closely in March 2026 amid volatile price swings and broader market uncertainty, as recent data shows sharp declines from earlier highs. This article breaks down the current trend, key support and resistance levels, technical indicators like RSI and MACD, and a short-term outlook to help retail traders navigate potential moves.
BMNU operates in the leveraged equity space, non-diversified and tied to financial instruments for daily 2x leverage. With prices hovering in the low $1-2 range early March after dropping from multi-dollar levels in late 2025, attention is on whether downside momentum persists or if a rebound forms. We’ll cover price trends relative to moving averages, critical levels, indicator signals, and what to monitor next.

Current Price Trend in March 2026
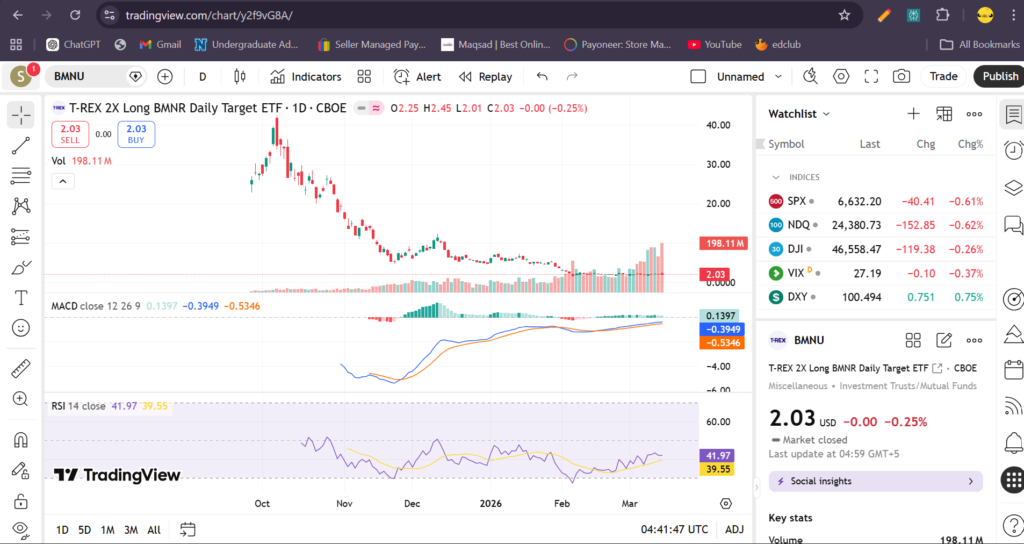
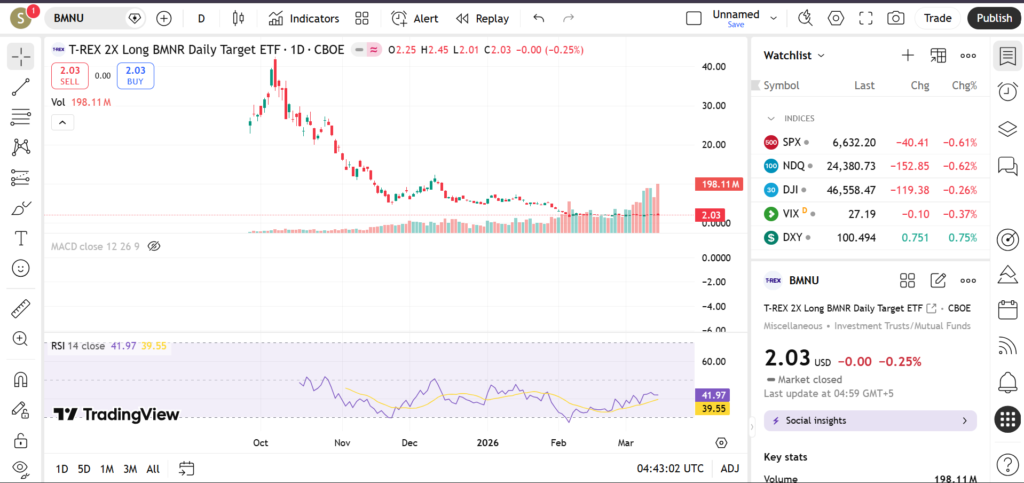
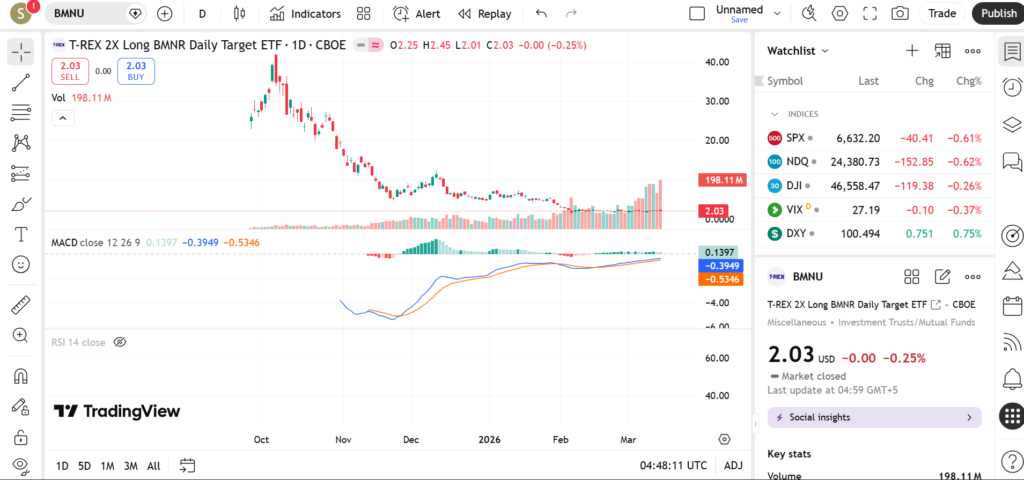
BMNU has been in a short-term downtrend throughout early March 2026, with prices declining steadily from around $2.18 on March 4 to $1.74 by March 6. This follows a pattern of lower highs and lower lows, reflecting fading momentum after earlier volatility seen in October 2025 when it swung between $20-40 before a prolonged drop.
The ETF trades well below key moving averages, including estimates of 20-day, 50-day, and 200-day MAs likely in the $3-10 range based on historical declines, signaling bearish control. Recent swings include a drop from $2.21 on March 2 to $1.79, with no major reversal yet, though traders may eye any stabilization near recent lows for signs of exhaustion.
Key Support and Resistance Levels
Important support levels for BMNU include:
- Near $1.70, aligning with the March 6 low and a potential gap fill from prior sessions, where buyers stepped in briefly.
- Around $1.50-$1.60, a round number zone and possible extension of the downtrend from February lows near $1.79, tested as psychological support.
- Below $1.40, matching early March volume clusters and 52-week lows, which could act as major downside protection if breached.
Key resistance levels consist of:
- $1.85-$1.90, recent swing highs from March 3-6 and near the 20-period MA, where sellers emerged previously.
- $2.00-$2.10, a significant round number and prior consolidation zone from early March, coinciding with option strikes.
- Higher at $2.20, matching March 4 highs and potential 50-day MA approximation, a hurdle for any rally attempt.

A break below $1.70 support could signal further downside toward $1.50, indicating continued bearish pressure, while a close above $1.90 resistance might suggest short-term relief and test of $2.00.
Indicators – RSI, MACD, Volume
RSI on BMNU appears oversold in the low 30s or below after the recent plunge, based on sharp declines from $2+ levels, hinting at potential bounce opportunities though divergence is not yet confirmed. This neutral-to-oversold reading advises caution, as leveraged ETFs can stay extended in trends.
MACD shows bearish momentum with the line likely below the signal amid fading histogram bars, reflecting the downtrend acceleration from late 2025 highs. No bullish crossover is evident, suggesting sellers dominate short-term.
Volume has spiked on down days in early March, such as around March 4-6 sessions, with rising activity on declines but lighter on any minor recoveries, confirming bearish conviction.

Short-Term Outlook for BMNU in March 2026
The technical picture for BMNU remains bearish in March 2026, dominated by a downtrend below moving averages, oversold RSI hinting at possible pauses, and confirming MACD/volume signals. Traders may watch for stabilization near key supports, but leverage amplifies risks in this volatile setup.
- Key support hold at $1.70 amid any BMNR underlying moves or macro shifts.
- Resistance test at $1.90 on volume pickup, potentially signaling relief rally.
- Sector catalysts like Treasury yield changes impacting BMNR.
- Upcoming economic data or Fed comments as volatility drivers.
- Break below $1.50 could eye deeper lows near 52-week territory.
Risks and Important Notes
Technical levels in leveraged ETFs like BMNU can fail unexpectedly due to news on the underlying BMNR, sudden macro events, or shifts in volatility regimes. Always consider the daily reset nature of 2x products, which can lead to decay in sideways markets.
This analysis is educational and not personalized financial advice; retail traders should use risk management and consult professionals.
For more insights, check our technical analysis on similar leveraged ETFs like TMF or UST, and stay updated on Treasury-related funds.