

BMNG Technical Analysis: Trend, Levels & Outlook March 2026
Leverage Shares 2X Long BMNR Daily ETF (BMNG) is a single-stock leveraged exchange-traded fund designed to deliver twice the daily performance of BMNR stock. Leveraged single-stock ETFs have become increasingly popular among short-term traders because they provide amplified exposure to individual companies without the need for margin trading or options strategies. BMNG belongs to the leveraged single-stock ETF sector, which focuses on magnifying daily price movements of specific equities.
Traders are paying close attention to BMNG in March 2026 due to the volatility in the underlying stock and the broader market environment. Leveraged ETFs tend to react strongly to even small price movements in their underlying asset, making them attractive to traders seeking short-term momentum opportunities. In this article, we examine BMNG’s current price trend, key support and resistance levels, and important technical indicators such as RSI, MACD, and volume behavior to help traders understand the potential technical setup during this period.

Current Price Trend in March 2026
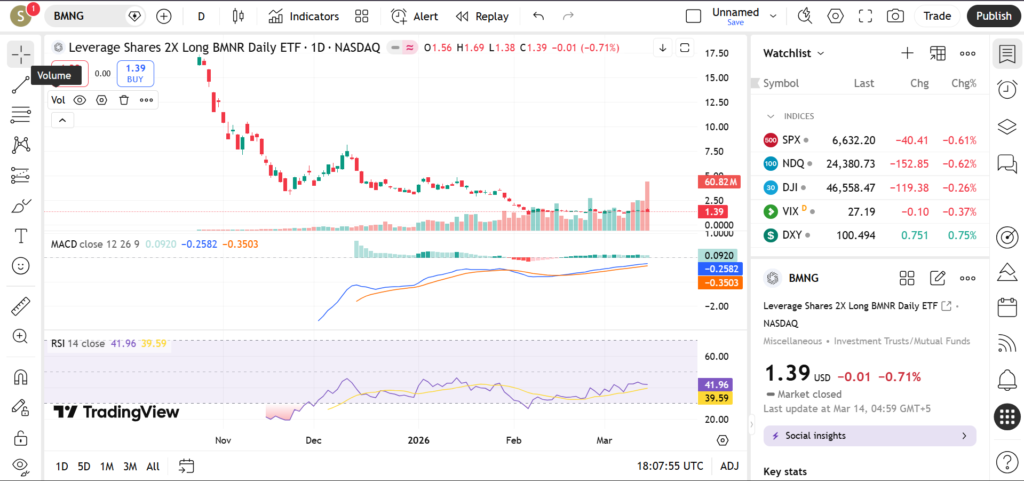
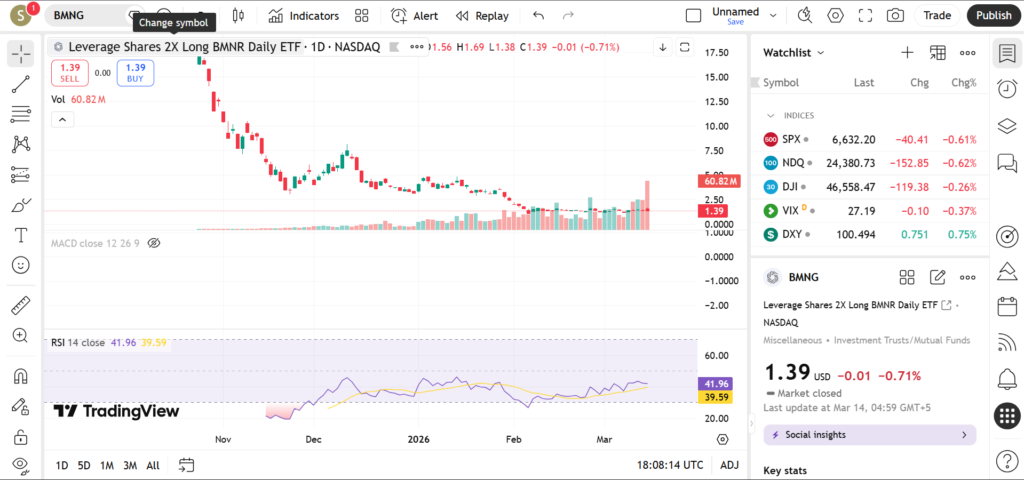
BMNG has been trading in a volatile short-term trend during March 2026, reflecting amplified movements in the underlying stock. Leveraged ETFs often show sharper swings compared with traditional ETFs, and BMNG has demonstrated this behavior throughout the month with rapid rallies followed by brief pullbacks.
The 20-day moving average has recently acted as short-term support during minor corrections. Price has tended to rebound when approaching this moving average, suggesting that short-term traders are using dips as opportunities to enter positions aligned with the broader momentum.
The 50-day moving average offers insight into the intermediate trend. BMNG has spent most of the recent period trading above this level, indicating that medium-term momentum remains constructive despite occasional volatility.
Meanwhile, the 200-day moving average serves as a long-term trend reference. As long as the ETF remains above this average, many technical traders interpret the broader market structure as supportive of further upward movement, although leveraged ETFs can still experience significant short-term fluctuations.
Recent price swings suggest the formation of higher lows following pullbacks, a pattern that often indicates underlying buying interest. However, the ETF has also faced resistance near recent highs, suggesting that the market may temporarily consolidate before determining the next direction.
Key Support and Resistance Levels
Support and resistance levels provide important clues about where buying or selling activity may increase.
Support Levels
The first key support level appears near the recent swing low, where the ETF previously rebounded during the latest correction. This level represents an area where buyers demonstrated willingness to defend the price.
Another support zone lies near the 50-day moving average, which has historically served as dynamic support during trending phases.
A deeper support region could emerge near the 200-day moving average, which often acts as a longer-term safety net during extended corrections.

Psychological round numbers may also function as additional support levels because traders frequently place orders near these points.
Resistance Levels
On the upside, the first resistance level can be identified near the most recent swing high, which previously halted the latest rally.
Another resistance zone appears near prior consolidation highs, where selling pressure emerged during earlier attempts to move higher.
A stronger resistance area may exist near previous yearly highs, where momentum slowed in earlier market cycles.
A breakout above these resistance zones could indicate renewed bullish momentum, while repeated rejections may lead to additional consolidation.
Indicators – RSI, MACD, Volume
The Relative Strength Index (RSI) currently fluctuates within the upper neutral range, suggesting moderate bullish momentum without reaching extreme overbought levels.
The MACD indicator continues to show positive momentum overall, though the histogram has recently begun to narrow slightly, which can indicate a temporary slowdown in the pace of gains.


Volume patterns have shown strong participation during rallies, indicating active trading interest. Pullbacks have generally occurred on lighter volume, which can sometimes suggest that selling pressure is not particularly aggressive.
Short-Term Outlook for BMNG in March 2026
The technical structure for BMNG remains constructive as long as price continues to hold above key moving averages. However, the recent slowdown in momentum suggests that the ETF could experience a period of sideways consolidation before the next significant move.
What traders are watching:
• Breakout above the most recent swing high
• Continued support near the 50-day moving average
• Volume expansion during rallies
• RSI movement toward stronger bullish momentum
• News or developments affecting the underlying stock
Risks and Important Notes
Leveraged single-stock ETFs carry significant volatility because they magnify daily movements of their underlying asset. Unexpected corporate news, earnings surprises, or broader market volatility can quickly alter price trends.
This article is intended for educational purposes only and should not be interpreted as financial advice.
For additional insights, traders may also explore technical analysis of other leveraged ETFs and sector-specific funds to gain a broader view of market sentiment.