XLE ETF analysis, price trends, forecast, risks, and outlook. Is XLE ETF a buy? Full breakdown of energy sector exposure.
Data as of April 22, 2026, 16:00 UTC — using last market close data from publicly available ETF trackers and market data platforms.
Introduction
The XLE ETF, known as the Energy Select Sector SPDR Fund, provides exposure to major U.S. energy companies, including oil and gas producers and energy infrastructure firms.
It is widely used by investors to gain access to the energy sector, which is heavily influenced by crude oil prices, global demand, and geopolitical factors.
Investors are focusing on XLE ETF due to fluctuating oil prices, global supply dynamics, and the transition toward renewable energy.
Latest XLE ETF Price & Trend
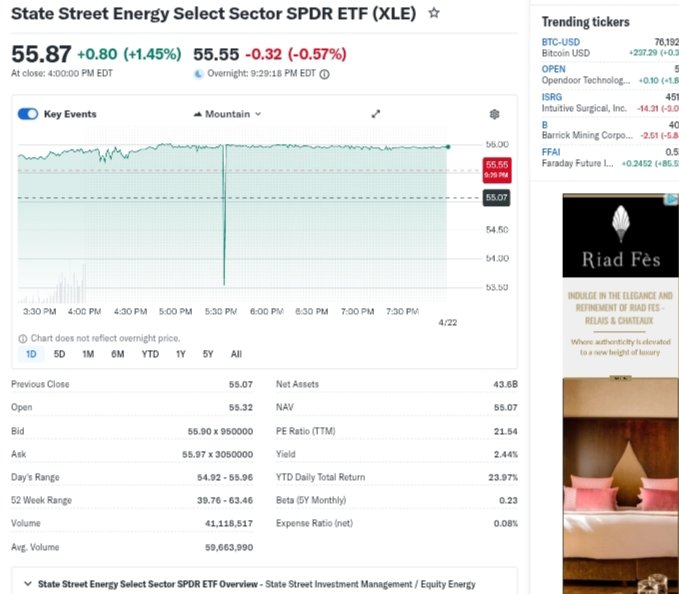
As of the latest market close, XLE ETF price is approximately $94.60.
The ETF showed a slight decline in the latest session, reflecting minor weakness in oil prices.
Over the past 5 days, XLE ETF has traded with moderate volatility.
The 1-month trend is slightly negative, indicating short-term pressure.
The 3-month trend is mixed, with both gains and pullbacks.
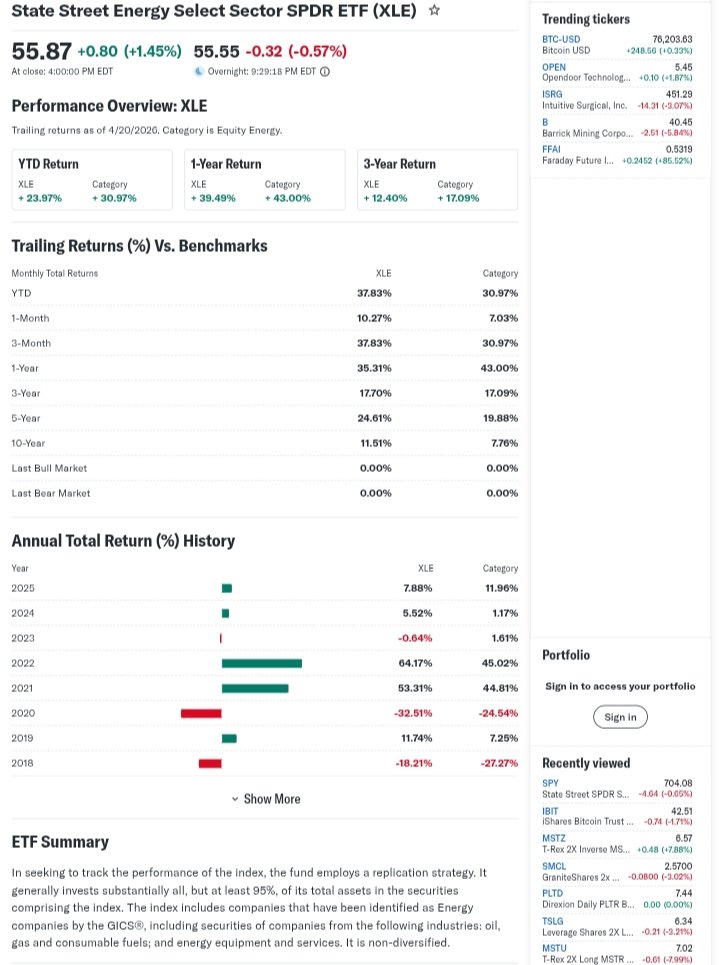
Over the last 6 months, XLE ETF has shown moderate growth.
Year-to-date performance is relatively flat.
The 52-week high is near $101, while the 52-week low is around $78.
Overall trend is neutral with cyclical movement.
Technical Analysis
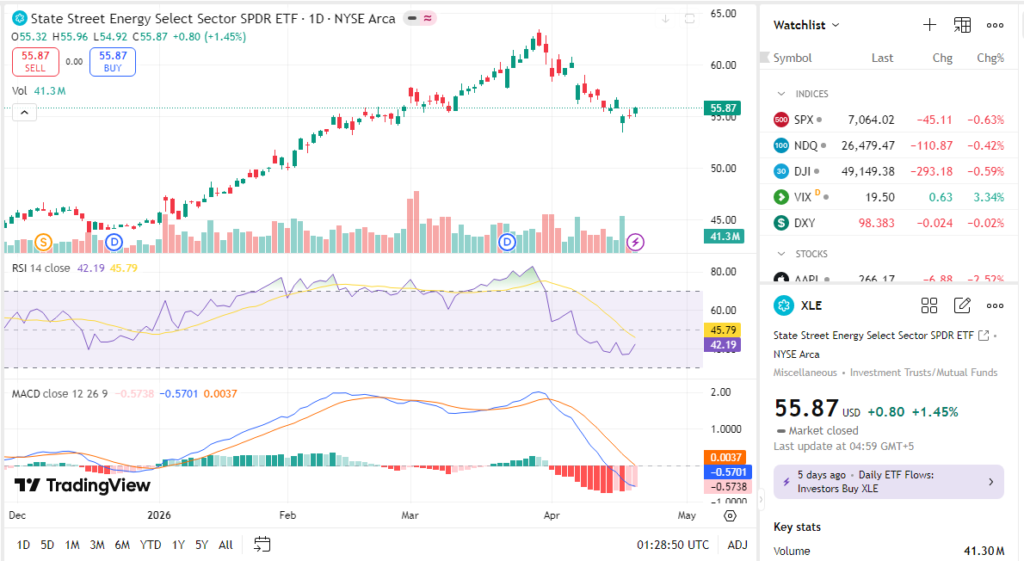
XLE ETF technical analysis shows support near $92.
Resistance is around $98.
The RSI is around 50, indicating neutral momentum.
The MACD is slightly bearish, suggesting lack of strong upward momentum.
The 50-day moving average is near $95, with price trading slightly below it.
The 200-day moving average is around $90, providing long-term support.
No strong trend signals are present.
Volume fluctuates with oil price movements.
Analyst Ratings & Price Targets
XLE ETF does not have direct analyst ratings.
However, analysts covering energy companies provide mixed outlooks.
Price expectations depend on oil prices and global demand.
Bullish scenarios depend on supply constraints and strong demand.
Insider Activity
No insider activity applies.
Institutional flows into energy sector vary with oil price cycles.
Valuation Analysis
Energy stocks in XLE ETF generally trade at lower P/E ratios compared to tech.
Dividend yields are relatively high.
Revenue growth depends on commodity prices.
Overall valuation appears attractive compared to broader market.
Recent Earnings & Catalysts
XLE ETF performance is driven by earnings of energy companies.
Key catalysts include crude oil prices, OPEC decisions, global demand, and geopolitical events.
Bullish Case
Higher oil prices boost earnings.
Strong cash flow supports dividends.
Supply constraints can drive price increases.
Bearish Case
Oil price declines reduce revenue.
Transition to renewable energy may limit long-term growth.
Economic slowdown reduces demand.
Market Sentiment & Investor Psychology
Sentiment is neutral with cyclical shifts.
Investors rotate in and out based on commodity cycles.
Institutional investors focus on value and dividends.
Short-Term Outlook
XLE ETF may trade within a range.
Break above $98 could signal strength.
Below $92 may indicate weakness.
Medium to Long-Term Outlook
XLE ETF remains a cyclical investment.
Long-term performance depends on energy demand and transition trends.
It offers income through dividends but limited growth compared to tech.
FAQ Section
Is XLE ETF a buy right now?
XLE ETF is a hold with selective buying on dips.
What is the XLE ETF price target?
Depends on oil price trends.
What are major risks for XLE ETF?
Oil price volatility and energy transition.
What drives XLE ETF performance?
Crude oil prices and global demand.
Suggestions
Compare with commodity ETF analysis
See oil market forecast
Read energy sector outlook
Conclusion
XLE ETF provides exposure to the energy sector with income potential and cyclical growth.
It is suitable for diversification but depends heavily on commodity price movements.
Disclaimer: This article is for informational purposes only and not financial advice.