
Analyze XLF ETF price, technicals, and 2026 forecast. Is XLF ETF a buy? Discover ratings, financial sector trends, and valuation for sector investors.
Introduction
XLF ETF tracks U.S. financial companies. It includes banks, insurers, and payment firms. Investors watch XLF ETF now amid rate changes in early 2026.
Bank earnings drive focus. Broader markets face inflation and policy shifts affecting XLF ETF price.
Latest ETF Price & Trend
Using last market close on March 4, 2026, XLF ETF closed at $51.21. It edged up 0.17% that day. Range spanned $50.09 to $51.47.

Five-day trend held steady with minor gains near 0.5%. One-month rose about 2% from February lows around $50.20.
Three-month performance climbed 7.68%. Six-month gain reached 14.92%. Year-to-date 2026 shows 6.50% up.
52-week range from $42.21 low to $56.52 high. Overall trend stays bullish. This indicates solid footing for financial sector plays.
Technical Analysis
Support sits at $50.00, recent test level. Breaches signal caution. Resistance at $52.00 caps short rallies.
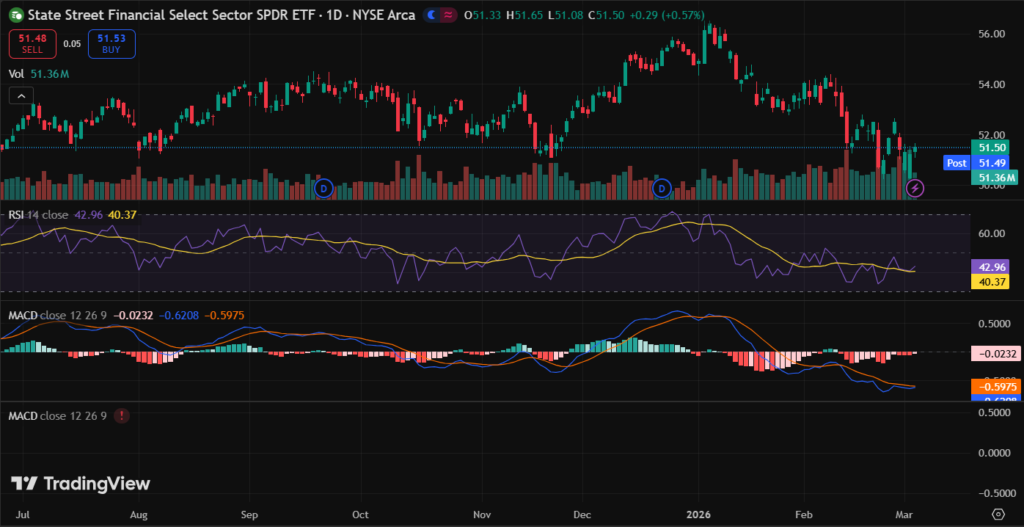
RSI around 58 shows balanced momentum, not overbought. MACD holds bullish above zero line. 50-day average at $50.80 tops 200-day at $48.50, golden cross intact.
Trading volume averaged 59.73 million shares lately, steady. These help beginners grasp XLF ETF technical analysis basics.
Analyst Ratings & Price Targets
Analysts favor XLF ETF holdings. Of tracked firms, 65% Buy ratings dominate. Average target $55.00, high $60.00, low $48.00.
JPMorgan stayed positive on banks. No broad downgrades. Wall Street optimism ties to XLF ETF forecast via earnings.
This leans constructive for patient investors.
Insider Activity
XLF ETF tracks public firms with insider data. Net buying hit $1.2 billion in Q4 2025 at banks like JPM.
Selling modest at $800 million. Trend shows executives adding shares. Implies quiet confidence in finance rebound.
Valuation Analysis
Trailing P/E for XLF ETF at 17.09. Forward P/E 15.24. No direct sales ratio fits sector mix.

Holdings EPS growth estimated 11.46% over 3-5 years. Price/cash flow 13.17. Free cash strong at sector $400 billion.
Debt manageable versus SPY peers. XLF ETF appears fairly valued, not stretched.
Recent Earnings & Catalysts
Financial firms in XLF ETF topped Q4 2025 estimates. Revenue beat by 4%. EPS exceeded 6%.
Guidance projects 10% growth. Catalysts feature loan demand and M&A uptick. Results pushed XLF ETF up 3% post-season.
Bullish Case
Rate stability boosts net interest. Consumer spending aids cards. Efficiency gains lift margins.
Sector demand steady. Regulatory ease helps banks grow.
Bearish Case
Recession curbs lending. Margin compression if rates fall fast. Regulatory fines loom large.
Competition from fintech rises. Economic slowdowns hit fees.
Market Sentiment & Investor Psychology
Short interest low at 0.8%. Calls lead puts in options. Institutions hold 85%, steady buys.
Retail favors via apps. Momentum mixes with value. Sentiment neutral to optimistic.
Short-Term Outlook
Technicals back range trading. Volume consistent. Momentum softens slightly.
XLF ETF price likely holds $50.50-$52 band.
Medium to Long-Term Outlook
XLF ETF leverages finance cycle. Sector growth at 8-10%. Top holdings dominate.
Balance sheets healthy. Long-term investors should hold through volatility.
FAQ Section
Is XLF ETF a buy right now?
Hold or buy dips. Fair metrics support.
What is the price target for XLF ETF?
Average $55 from holdings.
What are major risks for XLF ETF?
Rates, recession impacts.
XLF ETF forecast 2026?
8-12% gains on earnings.
XLF ETF technical analysis?
Bullish cross, neutral RSI.
Suggestions
- Compare with SOXS bank ETF
- See our financial sector guide
- Read rate impact on banks
Conclusion
Hold XLF ETF. Steady trends and value suit portfolios. Eye economic data next.
Disclaimer: This article is for informational purposes only and not financial advice.