Explore XLE ETF price trends, technical analysis, valuation, and 2026 forecast. Is XLE ETF a buy amid energy sector rally? Latest data and analyst views included.
Introduction
The XLE ETF tracks the energy sector of the S&P 500. It holds major oil and gas firms like Exxon Mobil and Chevron.
Investors watch XLE ETF now due to oil price swings and geopolitical tensions. Energy demand stays strong despite renewables push.
Broader markets face inflation worries. President Trump’s policies boost U.S. drilling. This lifts XLE ETF amid sector rotation from tech.
Latest ETF Price & Trend
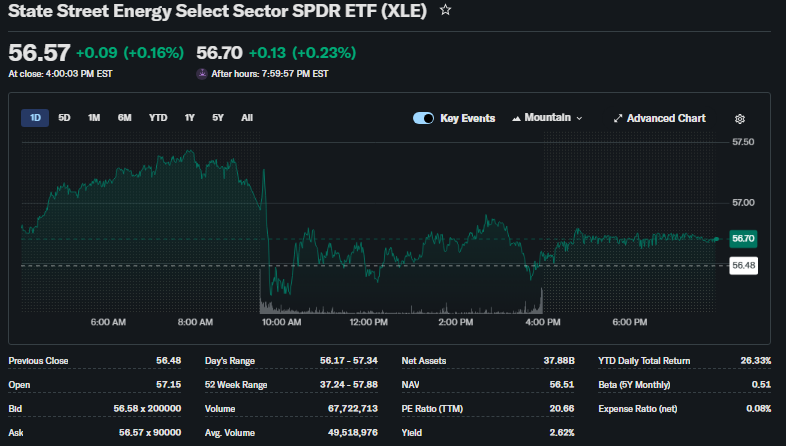
XLE ETF closed at $56.57 on March 6, 2026, per last market data.
It rose 0.16% in the day. Five-day gain hit 0.21% from recent lows.
One-month trend shows +6.23%. Three-month up 23.19%. Six-month climbed 29.51%. Year-to-date, XLE ETF gained 26.53%.
52-week low stands at $37.24. High reached $57.88.
Trend looks bullish. Strong gains signal investor shift to energy. This favors XLE ETF holders seeking diversification.
Technical Analysis
Support levels sit at $53.93. A drop below risks $52.15. Resistance looms at $57.69.
RSI at 69.36 shows neutral, nearing overbought. It measures speed of price moves to spot exhaustion.

MACD at 1.67 gives buy signal. This tracks momentum via moving average crossovers.
50-day moving average nears $49.53. 200-day at $45.43. XLE trades above both, bullish.
No golden cross noted recently. Volume trends support upmove with steady trading.
These point to continued strength for XLE ETF if support holds.
Analyst Ratings & Price Targets
Analysts lean hold for XLE ETF. Average target $57-$101, high $122.76, low $48.
23 firms rate it mostly neutral. Some see upside from oil stability.
No major upgrades lately. Wall Street cites oil volatility.
This sentiment means caution. Investors use it to gauge pro views on XLE ETF.
Insider Activity
XLE ETF shows no recent insider buys or sells. Holdings like Exxon report minimal trades.
Managers hold steady. No large transactions signal confidence.
Trend implies caution in volatile energy. Lacks buying to show strong faith.
Valuation Analysis
XLE ETF trailing P/E around 17.4. Forward P/E similar.

Price-to-sales low for sector. Top holdings show YoY revenue steady despite oil dips.
EPS growth mixed; Exxon, Chevron saw declines from lower crude. Free cash flow solid at majors.
Debt manageable, cash buffers strong. Vs peers, XLE ETF fairly valued.
Not overvalued. Energy discipline aids appeal.
Recent Earnings & Catalysts
Holdings drove XLE ETF gains. Exxon, Chevron Q4 beat on cash flow, missed EPS from $64 oil.
Revenue met views. Guidance steady on supply cuts.
Catalysts include OPEC+ curbs, U.S. LNG exports. No big partnerships noted.
Earnings lifted XLE ETF 21.6% YTD as security fears rise.
Bullish Case
Oil demand from transport fuels inelastic.
OPEC+ supply limits aid prices. Majors like Exxon show capital discipline.
Geopolitics boosts U.S. energy edge. XLE ETF benefits from sector rotation.
Bearish Case
Competition from renewables grows. Oil price drops squeeze margins.
Economic slowdown cuts demand. Regulatory push on emissions adds costs.
Customer shift to EVs pressures refiners in XLE ETF.
Market Sentiment & Investor Psychology
Short interest at 76M shares, 3.42 days to cover. Moderate bear bets.
Institutional ownership high, over 1,800 holders added shares.
Options show balanced calls/puts. Retail chases momentum.
Sentiment optimistic on energy rebound.
Short-Term Outlook
Technicals favor upside if above support. Volume steady.
Momentum from oil holds. Expect sideways to higher in weeks.
Medium to Long-Term Outlook
Strong holdings, sector growth from demand. Financials solid.
Risks from green shift. Hold for long-term if energy bet.
Accumulate on dips for 6-24 months.
FAQ
Is XLE ETF a buy right now?
Hold or buy dips. Bullish trends outweigh risks short-term.
What is the price target for XLE ETF?
Average $57-$101. Base $60-70 by 2026.
What are major risks for XLE ETF?
Oil volatility, regulations, recession.
XLE ETF forecast 2026?
Moderate gains to $60-70 if oil stable.
Suggestions
Compare with SOXS stock analysis.
See Chevron ETF forecast.
Read energy sector valuation guide.
Conclusion
Hold XLE ETF. Gains from trends balance oil risks. Solid for diversification.
Disclaimer: This article is for informational purposes only and not financial advice.