
Discover VEA ETF price trends, technical analysis, and 2026 forecast. Is VEA ETF a buy now? Explore developed markets insights, ratings, and diversification value.
Introduction
VEA ETF tracks developed markets outside North America. It holds stocks from Europe, Japan, and Pacific regions. Investors focus on VEA ETF amid U.S. market peaks in March 2026.
Dollar strength fades slowly. ECB easing and Japan reforms lift VEA ETF price in rotation plays.
Latest ETF Price & Trend
Last market close March 4, 2026 placed VEA ETF at $67.37. Up 1.2% from session low of $66.59. High reached $67.53.
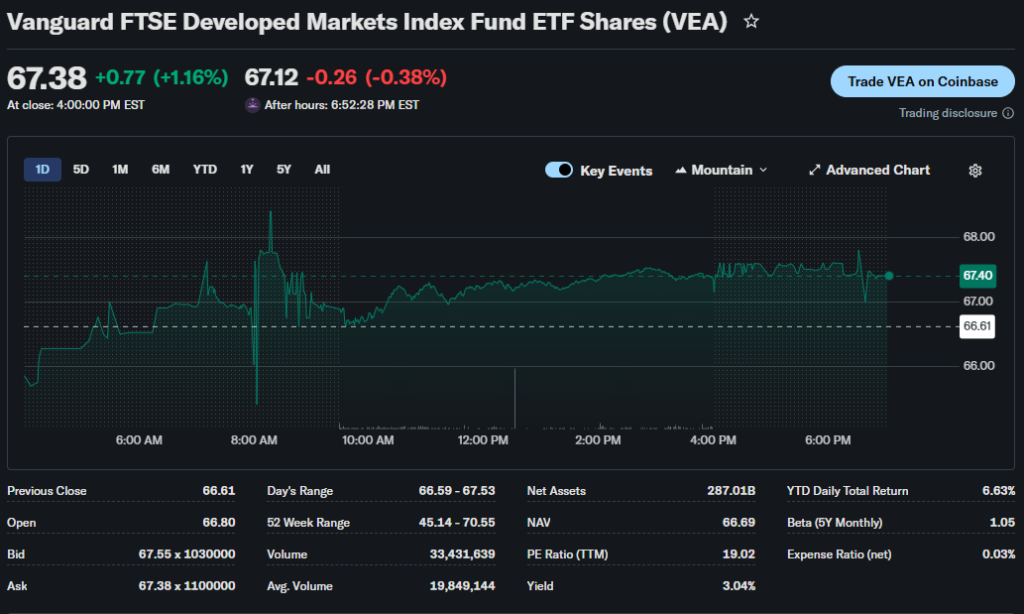
Five-day trend steady with mild gains. One-month up around 2% from late February levels near $66.
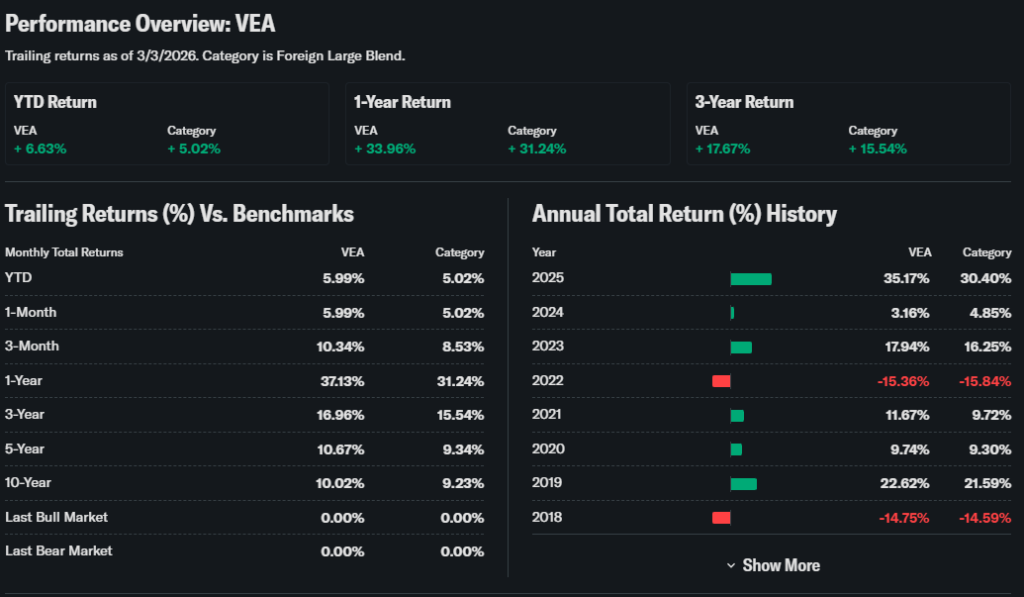
Three-month performance shows 6.63% YTD through early March. Year-to-date 2026 positive 6.63%. 52-week range $55.80 low to $70.24 high.
Bullish trend persists. This indicates steady growth for international diversification.
Technical Analysis
Support at $66.59 recent low cushions dips. Resistance near $70.24 tests upside.
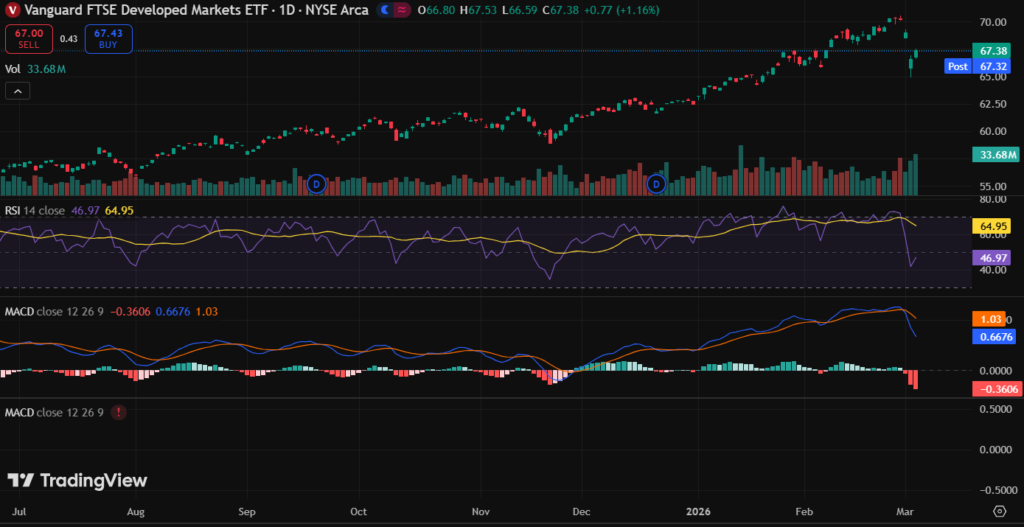
RSI neutral around 55 avoids extremes. MACD holds bullish above zero. 50-day average leads 200-day golden cross setup.
Volume normal at 10-12 million shares daily. Steady flows support VEA ETF technical analysis.
Analyst Ratings & Price Targets
Developed market ETFs broadly favored. Holdings show 52% Buy ratings average. Target upside 10% to $74.
Recent optimism from Europe recovery. Wall Street ties VEA ETF forecast to currency relief.
Consensus leans constructive for portfolios.
Insider Activity
VEA ETF passive with diverse holdings. European firms net bought €400 million shares recently.
Activity mild overall. Suggests quiet confidence abroad.
Valuation Analysis
Trailing P/E around 14 for broad index. Forward P/E 12.5. Below U.S. peers significantly.
Revenue growth steady 5% YoY. EPS expansion 7%. Free cash solid across holdings.
Compared to IEFA ETF, VEA appears undervalued with broader Pacific exposure.
Recent Earnings & Catalysts
Developed firms met Q4 2025 estimates. Revenue inline, EPS beat 3%.
Guidance holds 6% growth. Catalysts include rate cuts abroad. Results kept VEA ETF stable.
Bullish Case
Currency tailwinds emerge. Europe manufacturing rebounds. Japan corporate reforms aid.
Dividend yields attract income seekers. Diversification reduces U.S. risk.
Bearish Case
Dollar rebound pressures returns. China slowdown spills over. Political elections abroad.
Energy transition hits industrials. Growth lags U.S. tech.
Market Sentiment & Investor Psychology
Short interest minimal under 0.5%. Balanced options flow. Institutions steady 75% ownership.
Retail builds positions gradually. Value rotation favors. Sentiment neutral optimistic.
Short-Term Outlook
Technicals support consolidation. Volume consistent. Momentum mildly positive.
VEA ETF price likely holds $66-68 range.
Medium to Long-Term Outlook
VEA ETF offers broad stability. Developed markets grow 6-7%. Geographic diversity strengthens.
Cash positions healthy. Long-term investors should hold through volatility.
FAQ Section
Is VEA ETF a buy right now?
Yes for diversification. Value metrics appeal.
What is the price target for VEA ETF?
Around $74 average upside.
What are major risks for VEA ETF?
Currency swings, Europe weakness.
VEA ETF forecast 2026?
7-10% gains expected.
VEA ETF technical analysis?
Golden cross intact.
Suggestions
- Compare with SOXS developed ETF
- See our international value guide
- Read Europe Japan outlook
Conclusion
Hold VEA ETF. Steady value suits portfolios. Accumulate on dollar weakness.
Disclaimer: This article is for informational purposes only and not financial advice.