
VCIT ETF forecast 2026: Analyze price trends, technicals, valuation, and outlook for Vanguard Intermediate-Term Corporate Bond ETF. Is VCIT ETF a buy? Latest data reviewed.
Introduction
VCIT ETF tracks intermediate-term corporate bonds from U.S. investment-grade companies.
Investors watch it now for safety amid stock market swings in early 2026.
Rising rates and economic uncertainty boost demand for bond ETFs like VCIT ETF.
Latest ETF Price & Trend
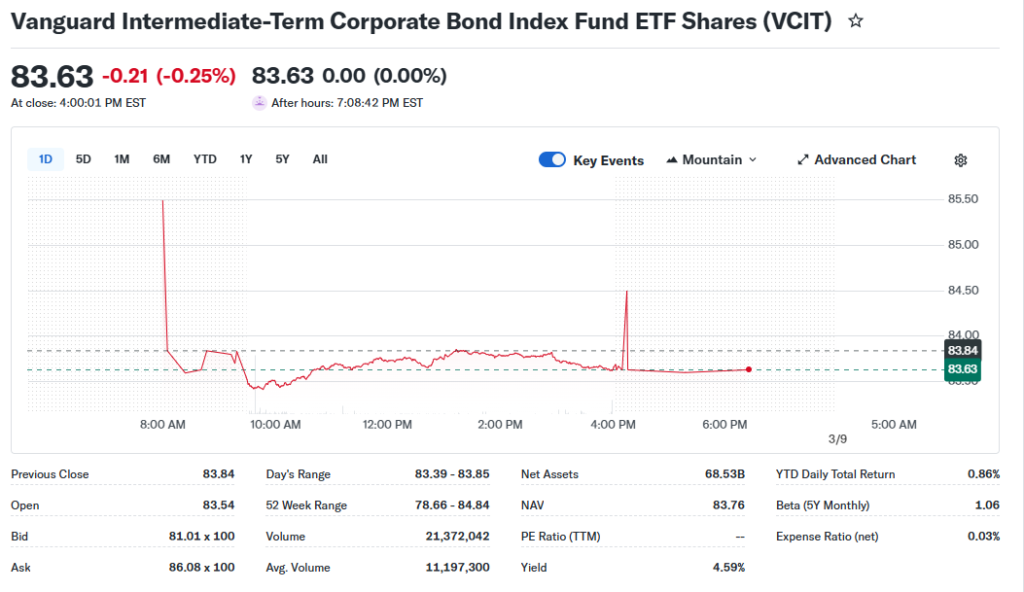
As of last market close on March 5, 2026, VCIT ETF price stood at around $83.94.
It saw a 1-day gain of about 0.1%, with 5-day trend up 1.14%.
Over one month, VCIT ETF price rose 1.53%; three months gained 3.85%; six months up roughly 6%.
Year-to-date through early March 2026, it returned 0.77% to 0.86%.
The 52-week range hit a high of $84.84 and low of $78.66.
This shows a bullish trend overall, with steady climbs signaling investor shift to bonds for yield.
Technical Analysis
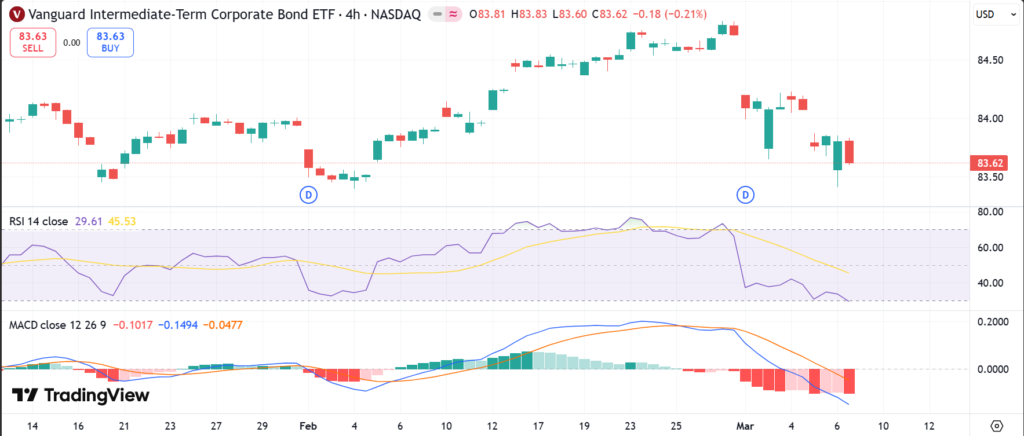
Support levels sit near $83.00, where buyers stepped in recently; resistance looms at $84.50.
Support matters as it shows price floors; resistance caps upside until broken.
RSI reading hovers near 60, neutral—not overbought above 70 or oversold below 30.
RSI gauges momentum; high values warn of pullbacks.
MACD shows bullish crossover, with lines above zero signaling upward drive.
MACD tracks trend speed; bullish means buyers lead.
VCIT ETF trades above 50-day and 200-day moving averages, at $83.50 and $82.00.
These averages smooth price action; staying above hints strength—no death cross seen.
Volume trends higher lately, at 10-12 million shares, confirming interest.
Analyst Ratings & Price Targets
Few direct analyst ratings exist for VCIT ETF, as bond funds rely less on them.
Macroaxis calls it “Cautious Hold” with fair valuation.
No major upgrades or downgrades noted from Wall Street firms like Bloomberg.
This neutral sentiment suits steady bond ETFs; investors see it as reliable, not speculative.
Insider Activity
ETFs like VCIT have no corporate insiders, so no buying or selling to report.
Vanguard manages flows passively; recent big inflows show institutional confidence.
This implies caution in volatile times—steady accumulation, not aggressive moves.
Valuation Analysis
Bond ETFs like VCIT ETF use yield metrics over P/E ratios.
Current yield around 4.5% annualized, based on NAV returns.
No trailing P/E applies; forward looks at rates—revenue from bonds grows with holdings.
Year-over-year, assets grew via inflows; EPS-like metric is per-share NAV up 1% over five years.
Free cash flow strong from bond coupons; low debt as investment-grade focus.
Compared to peers like iShares (IGIB), VCIT ETF appears fairly valued with lower fees.
It looks fairly valued for income seekers.

Recent Earnings & Catalysts
ETFs report no quarterly earnings; performance ties to bond index.
NAV returned 0.9% last month, beating category average slightly.
YTD 0.77% as of March 5 trails stocks but fits bond safety.
Catalysts include Fed rate cut talks and corporate debt demand.
Recent inflows boosted assets to $55 billion, lifting VCIT ETF price.
Bullish Case
Demand rises for intermediate bonds as stocks wobble.
VCIT ETF benefits from 2,248 high-grade holdings, low default risk.
Rate cuts could extend duration gains; yield appeals in low-growth economy.
Operational edge from Vanguard’s low 0.04% expense ratio.
Bearish Case
Rising rates could pressure prices if Fed hikes resume.
Corporate margin squeezes from recession fears hit bond quality.
Competition from Treasuries or shorter-term ETFs draws flows.
Regulatory shifts on bank holdings add caution.
Market Sentiment & Investor Psychology
Short interest minimal for ETFs; focus on flows instead.
Institutional ownership dominates at over 90%, with recent inflows.
Options activity light; calls slightly outpace puts on momentum.
Retail leans optimistic for yield; sentiment neutral to bullish.
Short-Term Outlook
Technicals point to mild upside if volume holds.
Support at $83.90 firms; watch resistance break.
Market momentum favors bonds amid equity dips—no big swings expected.
Medium to Long-Term Outlook
Strong index tracking suits duration risk.
Corporate bond sector grows with U.S. debt issuance.
Financial health solid; hold for income-focused portfolios.
Long-term investors should hold or accumulate on dips.
FAQ Section
Is VCIT ETF a buy right now?
Yes for bond diversification; cautious hold per metrics.
What is the VCIT ETF price target?
No formal targets; fair value near $84-85 on trends.
VCIT ETF forecast 2026?
Steady 4-6% returns if rates stabilize.
What are major risks for VCIT ETF?
Interest rate hikes, credit spreads widening.
VCIT technical analysis summary?
Bullish MACD, above MAs; RSI neutral.
Suggestions
Compare with SOXS ETF analysis
See our BND ETF forecast
Read corporate bond sector overview
Conclusion
Hold VCIT ETF for steady income in uncertain markets.
Trends support stability, but watch rates closely.
Buy / Hold / Watchlist: Hold.
Disclaimer: This article is for informational purposes only and not financial advice.