Discover UVXY ETF price trends, technical analysis, and 2026 forecast. Is UVXY ETF a buy? Analyze volatility exposure, ratings, and risks for smart investing.
Introduction
UVXY ETF offers 1.5x leveraged exposure to short-term VIX futures. It rises when market fear grows, suiting hedges against stock drops. Investors eye UVXY ETF now as equity rallies fade and uncertainty builds. Broader conditions like Fed rate hints and geopolitical tensions boost volatility demand.
Latest ETF Price & Trend
UVXY ETF closed at $47.86 on March 3, 2026, per last market data. It swung from $42.82 to $49.58 that day, up sharply. Five-day trends climbed with VIX spikes.
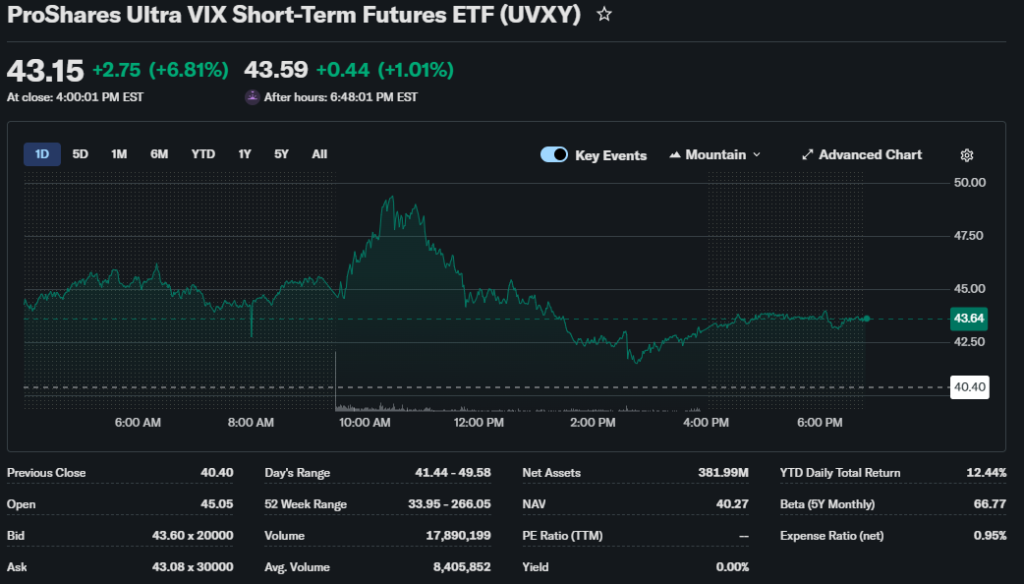
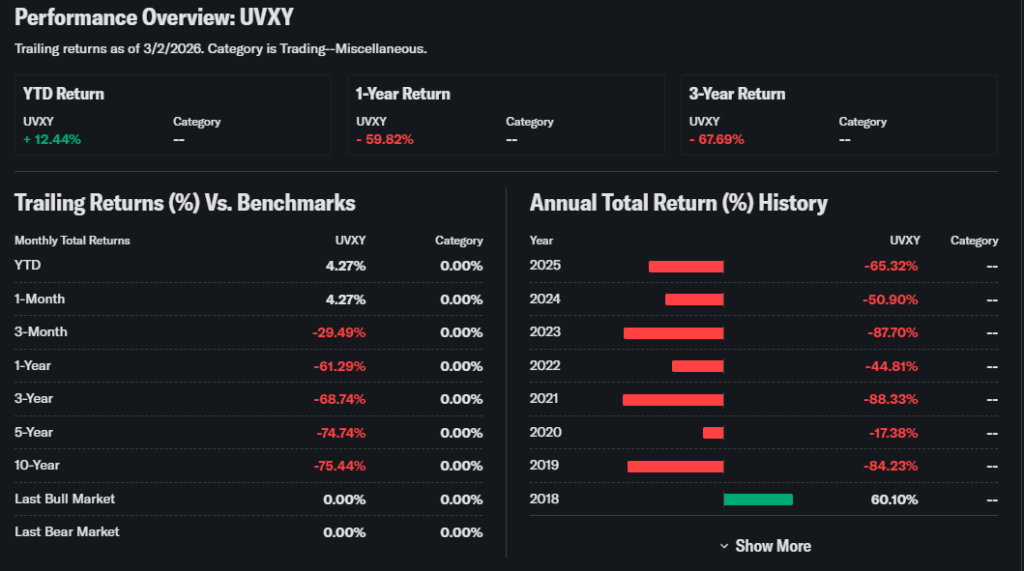
One-month gains hit double digits amid fear. Three-month and six-month periods show wild swings, year-to-date up over 300% from lows. 52-week high reached $266.05, low at $33.95. Overall trend stays bullish in fear phases but decays in calm markets. Investors see hedge value yet high risk of erosion.
Technical Analysis
Support levels hold near $42.00, where dips find buyers. Resistance caps at $50.00, testing fear peaks. RSI reading above 70 signals overbought conditions. MACD trend shows bullish crossover, favoring upside momentum.
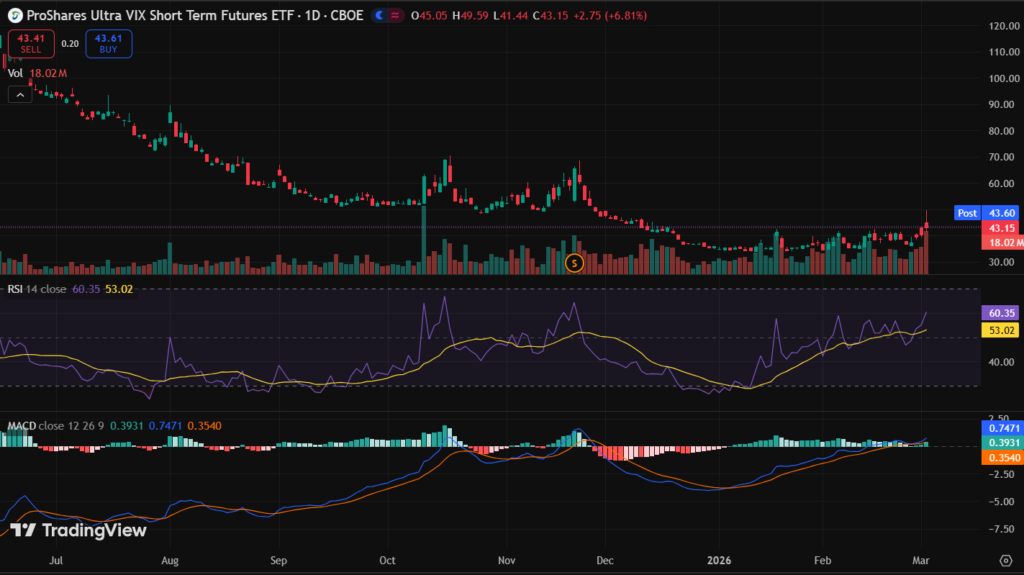
50-day moving average crossed above 200-day in a golden cross setup. Trading volume surges on up days, confirming interest. Support shows where prices may bounce; resistance blocks gains. RSI flags buy/sell extremes; MACD spots trend shifts. Moving averages smooth price action; crosses predict direction. Volume reveals conviction behind moves.
Analyst Ratings & Price Targets
Few traditional ratings cover UVXY ETF due to its niche role. Seeking Alpha views lean Hold for short-term trades. No clear Buy/Sell counts; targets vary widely. Highest sights tie to VIX blowups near $60. Lowest expect decay to $30s in calm times. Wall Street cautions on leverage risks. Sentiment warns of timing traps for everyday investors.
Insider Activity
ETFs like UVXY ETF lack corporate insiders. Fund flows act as proxy. Recent inflows hit millions during volatility pops. No selling noted; creation units grew. This hints at tactical confidence in fear hedges.
Valuation Analysis
UVXY ETF skips P/E ratios as a futures product. Expense ratio at 0.95% adds drag over time. No revenue or EPS applies directly.
Free cash flow irrelevant; assets track VIX futures. Compared to VXX or SVXY, UVXY amplifies moves at higher cost. It trades fairly valued for its volatility niche, not cheap or rich.
Recent Earnings & Catalysts
ETFs report no earnings. Performance links to VIX futures rolls. Recent VIX jump past 25 fueled gains. No guidance; catalysts include market crashes or news shocks. Volatility bets drove UVXY ETF price up 11.8% in one session.
Bullish Case
VIX spikes lift UVXY ETF fast. Equity corrections create demand. Short-term hedges draw traders. Low entry barriers aid access. Fear cycles repeat reliably.
Bearish Case
Contango erodes value in calm markets. Leverage decays holdings daily. High fees compound losses. Competition from UVIX grows. Regulatory caps on volatility products loom.
Market Sentiment & Investor Psychology
Short interest runs low at under 1%. Options favor calls in fear trades. Institutions hold steady; retail piles in on spikes. Momentum rules over value. Sentiment skews optimistic for hedges, fearful for longs.
Short-Term Outlook
Overbought RSI warns of pullbacks. Volume supports momentum if VIX holds. Expect swings tied to market news. Sideways equities may cool UVXY ETF.
Medium to Long-Term Outlook
Model fits tactical use, not buy-and-hold. Volatility demand grows with uncertainty. Position weakens in bull markets. Health relies on fear events. Long-term investors should watch for entries, avoid accumulation.
FAQ Section
Is UVXY ETF a buy right now?
Watch for VIX peaks; Hold otherwise due to decay.
What is the price target for UVXY ETF?
Varies $30-$60; no consensus amid swings.
What are major risks for UVXY ETF?
Contango decay, leverage loss, calm markets.
UVXY ETF forecast short term?
Choppy with VIX direction key.
UVXY technical analysis summary?
Bullish MACD, overbought RSI, golden cross.
Suggestions
- Compare with SOXS ETF trends.
- See our VIX futures forecast.
- Read volatility ETF risks guide.
Conclusion
Watchlist UVXY ETF closely. Strong in fear but erodes in calm. Best for short hedges, not core holdings.
Disclaimer: This article is for informational purposes only and not financial advice.