
2x Long VIX Futures ETF (UVIX) Technical Analysis: March 2026 Trends and Levels
The 2x Long VIX Futures ETF (UVIX) delivers 2x leveraged daily exposure to short-term VIX futures, thriving in market fear spikes within the volatility trading sector. Traders watch UVIX closely in March 2026 amid equity selloffs and geopolitical tensions boosting VIX readings. This piece details the monthly trend, supports/resistances, RSI/MACD/volume, and trader focus points.
UVIX suits short-term volatility bets, resetting daily to amplify VIX moves but suffering decay in calm markets. We’ll explore price swings, averages, levels, indicators, and near-term signals.
Current Price Trend in March 2026
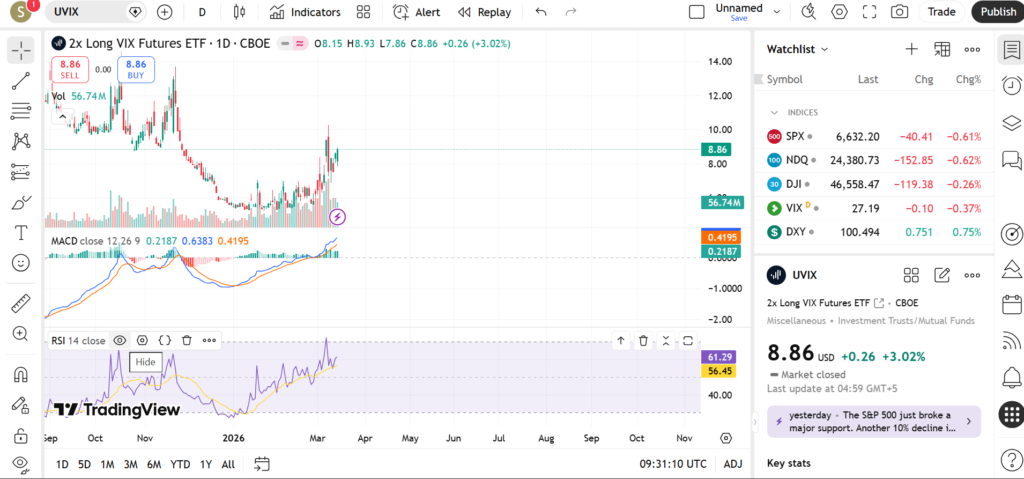
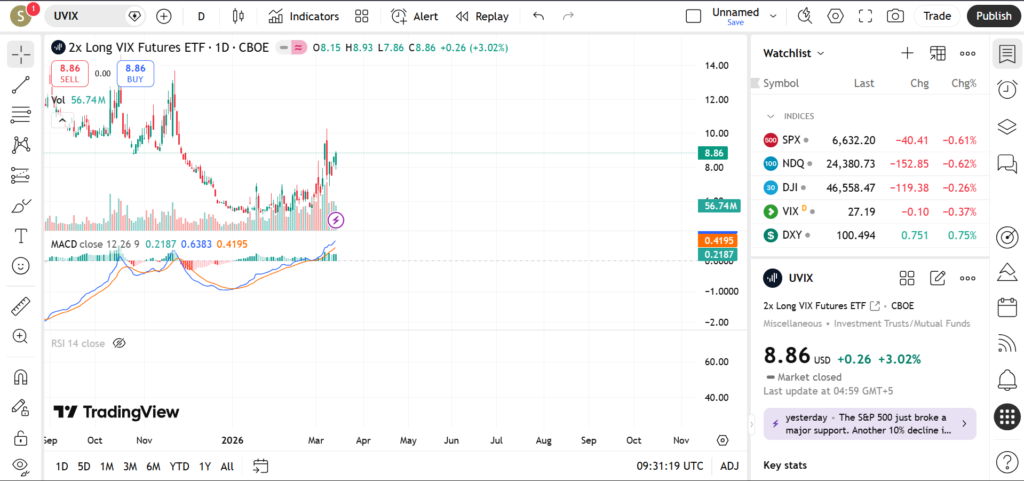
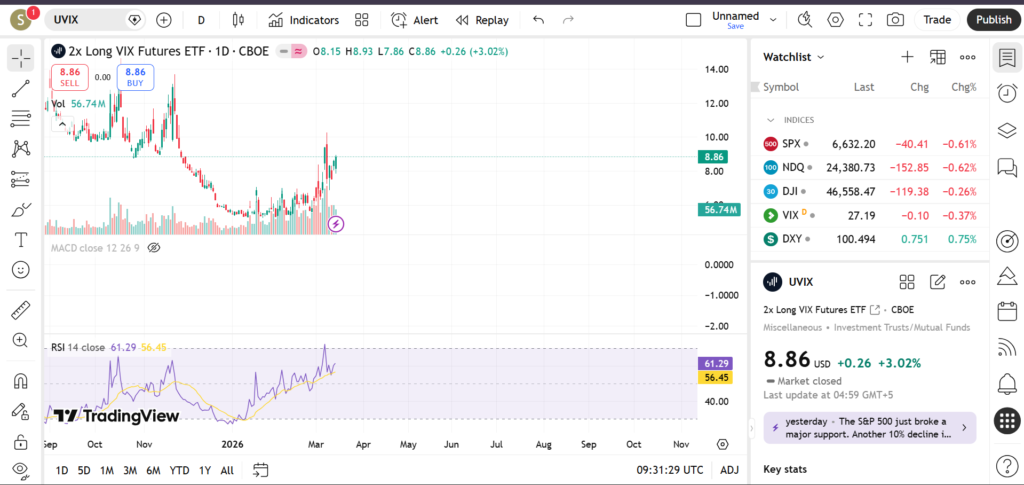
UVIX exhibits a volatile uptrend through March 2026, rebounding from early-year lows with higher highs and lows amid VIX contango shifts. Price action features sharp intraday swings, like the March 13 high near $9, reflecting fear gauge flares while testing short-term moving averages.
The 20-day MA provides support during pullbacks, 50-day slopes upward as a trend guide, and 200-day trails below, framing the multi-month recovery; key swings include a late-February bottom followed by 40% March rally, teaching traders how volatility leverage rewards timing.
Key Support and Resistance Levels
Critical supports anchor the uptrend:
- $7.80 – Recent session low and 20-day MA; key for continuation.
- $7.50 – Fibonacci 50% retracement; volume cluster.
- $6.90 – Early March swing low aligning with gap.
- $5.90 – Monthly low near 50-day MA.
Resistances loom overhead:
- $9.00 – Daily high and round number; breakout target.
- $9.50 – Prior resistance turned pivot.
- $10.30 – 52-week zone with overhead supply.
- $11.00 – Psychological level near 200-day MA approach.
Breaking above $9.00 resistance might propel UVIX toward $10.50, signaling sustained volatility, while sub-$7.80 support breach could retrace to $7, alerting hedgers to lighten up.
Indicators – RSI, MACD, Volume
RSI(14) fluctuates neutral-to-overbought above 60 in March rallies, flagging caution for pullbacks but supporting momentum in VIX products. Levels here help spot divergence from price extremes.
MACD displays bullish crossover with expanding positive histogram, showing building upside momentum—fading bars would warn of stalls. Volume surges on advances, like March 13 spike, dwarf pullback days, a bullish clue for volatility chasers.
Short-Term Outlook for UVIX in March 2026
UVIX’s March chart paints a bullish volatility bias, fueled by rising VIX and favorable indicators, though overextensions invite pauses. Traders might monitor supports for entries amid equity uncertainty.
What traders are watching:
- $9.00 resistance break on VIX >25 catalyst.
- S&P 500 drawdown below 5500 as VIX driver.
- March FOMC minutes for rate hike fears.
- Volume confirmation above $9.50.
- Contango unwind risks in VIX futures curve.
Risks and Important Notes
UVIX levels may snap on sudden risk-on rallies or VIX mean reversion, amplified by 2x leverage and futures roll costs. Unexpected calm or policy surprises often disrupt technicals.
This analysis educates; consult professionals and never risk more than you can lose.
Explore BMNG or SVIX analyses for volatility peers. Chart your edge today.