
Discover UVIX ETF price, performance trends, technical analysis, and forecast. Learn if UVIX ETF is a buy amid volatility trading in 2026. Balanced insights for investors.
Introduction
UVIX ETF tracks 2x the daily performance of VIX futures. It rises when market volatility spikes. Investors watch it now due to global uncertainties like trade tensions under President Trump. Broader market calm has pressured volatility products like UVIX ETF.
Latest ETF Price & Trend
UVIX ETF price closed at $6.37 on March 1, 2026, per recent trading data. It saw a 1-day gain of about 1.22% from prior levels around $6.29 low to $7.25 high. Over 5 days, it dipped 1.22% amid choppy volatility moves.
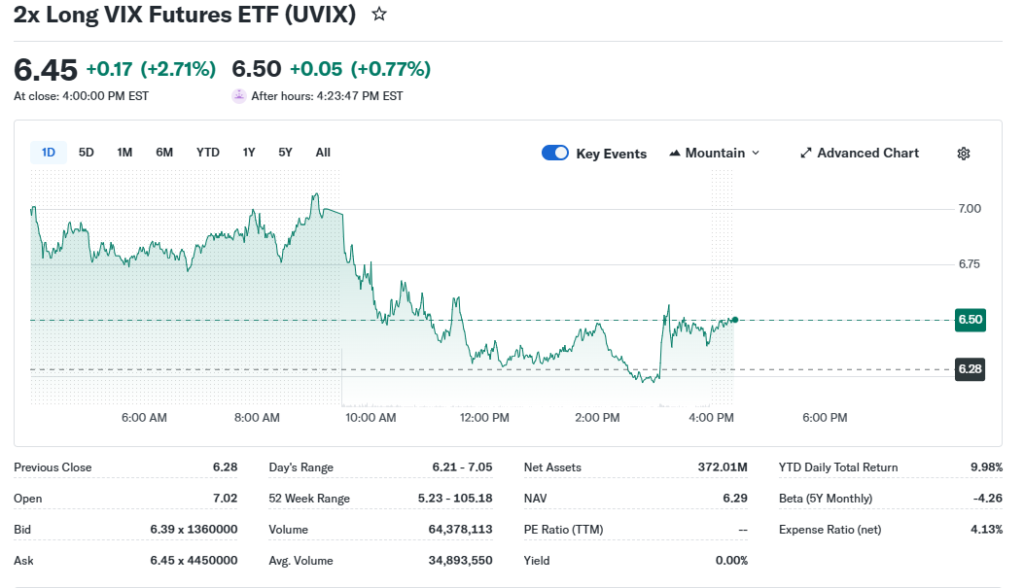
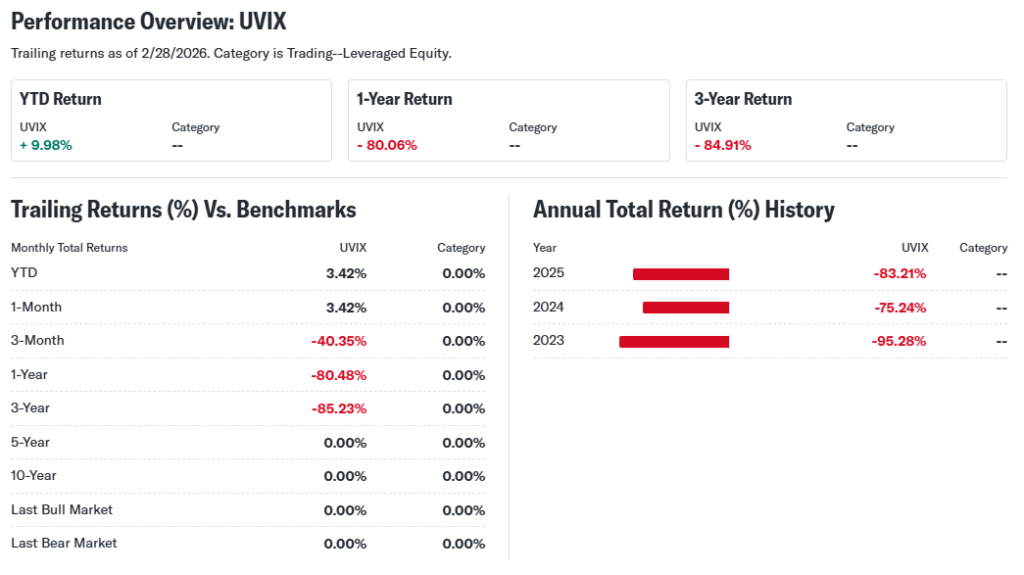
The 1-month trend shows a 34.48% drop from November peaks near $13.69. Three-month performance fell 28.33%, hitting lows around $6.88. Six-month losses reached 74.82%, with year-to-date down 78.65% from early 2025 highs over $105.
52-week range spans $6.88 low to $105.18 high, signaling extreme swings. Overall trend stays bearish as calm markets suppress VIX demand. This warns investors of decay in leveraged volatility bets during low-fear periods.
Technical Analysis
Support levels sit near $6.88, the recent low where buyers stepped in. Resistance looms at $7.79 from December highs. RSI reading hovers oversold below 30, hinting at potential bounce if volatility stirs.
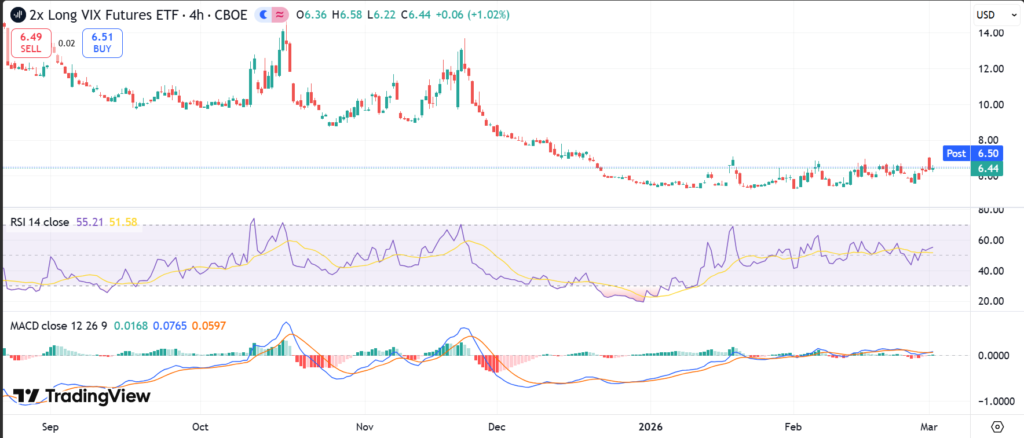
MACD shows bearish crossover, with signal line below zero, pointing to downward momentum. 50-day moving average at roughly $8.18 trails the 200-day at $9.93, no golden cross in sight. Trading volume trends lower, reflecting fading interest.
These indicators matter because support tests buying strength, while RSI flags exhaustion. MACD spots trend shifts early. Moving averages confirm direction—falling ones like UVIX ETF’s signal caution for entries.
Analyst Ratings & Price Targets
Few traditional Buy/Hold/Sell ratings exist for UVIX ETF due to its leveraged nature. No major Wall Street firms like Bloomberg issue standard targets; focus stays on volatility outlook. Recent notes from ETFdb highlight high-risk profile without upgrades.
Sentiment leans neutral—suitable for short-term trades, not long holds. Investors should view this as a tactical tool, not core holding, given structural decay risks.
Insider Activity
UVIX ETF lacks traditional insiders as it’s an ETF tracking futures. No recent buying or selling from management applies. Activity trends tie to Volatility Shares fund flows, showing net outflows amid low VIX. This implies caution in prolonged calm markets.
Valuation Analysis
ETFs like UVIX ETF skip standard P/E or EPS ratios. Trailing metrics N/A; focus on 2.19% expense ratio and $475.8M AUM. No revenue growth or free cash flow—it’s futures-based with daily resets causing decay. Debt/cash irrelevant.
Compared to plain VIX ETFs like VXX, UVIX appears high-cost leveraged play. Neither undervalued nor overvalued—value lies in volatility timing, not fundamentals. Fairly valued for its niche role.
Recent Earnings & Catalysts
ETFs report no quarterly earnings. Performance ties to VIX futures rolls. No revenue/EPS beats; guidance absent. Catalysts include potential 2026 rate cuts sparking volatility or geopolitical flares. Last volatility spike in late 2025 lifted UVIX briefly before fade.
Bullish Case
Volatility demand surges in downturns, doubling UVIX ETF gains short-term. Market stress from elections or inflation aids. Tech edges in futures tracking help efficiency. Low entry price attracts tactical traders.
Bearish Case
Contango erodes value in calm markets, as seen in 78% YTD drop. Competition from UVXY or SVIX dilutes flows. Margin decay from leverage hits long holds. Regulatory scrutiny on vol products adds caution. Economic stability caps upside.
Market Sentiment & Investor Psychology
Short interest data limited for ETFs. Options skew to puts amid bearish trend. Institutional ownership low; retail drives volume spikes. Momentum bias favors shorts in low VIX. Sentiment: fearful for holders, opportunistic for traders.
Short-Term Outlook
Technical oversold RSI and support at $6.88 suggest bounce potential. Low volume tempers momentum. Expect sideways chop unless VIX breaks 20—realistic range $6-8 without big news.
Medium to Long-Term Outlook
Business model suits volatility bets, not buy-and-hold. Industry growth tied to market fear cycles. Competitive position solid for 2x leverage. Financial health stable via AUM. Long-term investors should watch or avoid due to decay—accumulate only on vol spikes.
FAQ Section
Is UVIX ETF a buy right now?
No strong buy case in calm markets; better for short-term vol plays. Oversold signals watch, not commit.
What is the UVIX ETF price target?
No consensus targets; traders eye VIX levels for clues, like $10+ on spikes.
UVIX forecast for 2026?
Choppy with decay risks; upside on volatility waves, downside in stability.
What are major risks for UVIX ETF?
Leverage decay, contango losses, low volume traps.
UVIX technical analysis summary?
Bearish MACD, oversold RSI, key support $6.88.
Suggestions
Compare with SOXS ETF analysis
See VIX futures forecast
Read volatility ETF breakdown
Conclusion
Watchlist. UVIX ETF suits tactical traders eyeing volatility spikes, but decay and trends favor caution for most. Hold if positioned short-term; avoid long unless fear rises.
Disclaimer: This article is for informational purposes only and not financial advice.