
Discover UNG ETF price, performance trends, technical analysis, and forecast. Is UNG ETF a buy? Get balanced insights on natural gas exposure for investors.
Introduction
The UNG ETF tracks natural gas futures prices. It offers investors easy exposure to this volatile commodity without owning physical gas.
Focus on UNG ETF now stems from rebounding demand forecasts for 2026. Global natural gas use grew just 0.5% last year but eyes 2% growth ahead. Broader energy markets face weather swings and LNG export surges, impacting UNG ETF price.
Latest ETF Price & Trend
UNG ETF closed at $13.83 on March 2, 2026, up 4.17% from $13.22 the prior day. This one-day gain reflects short-term buying on cold weather bets.
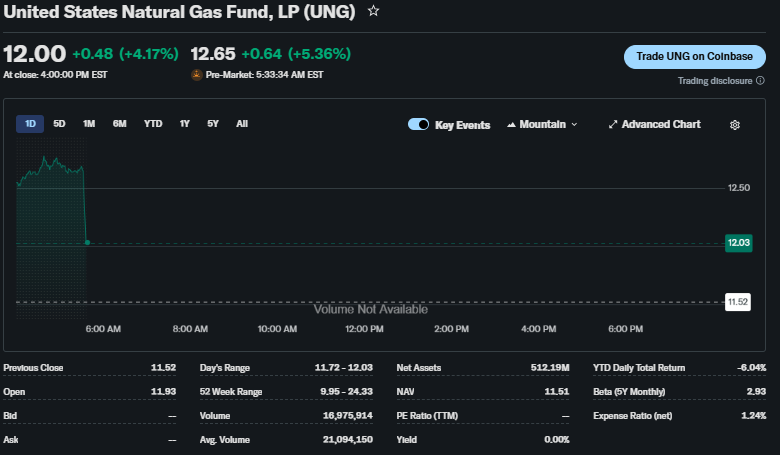
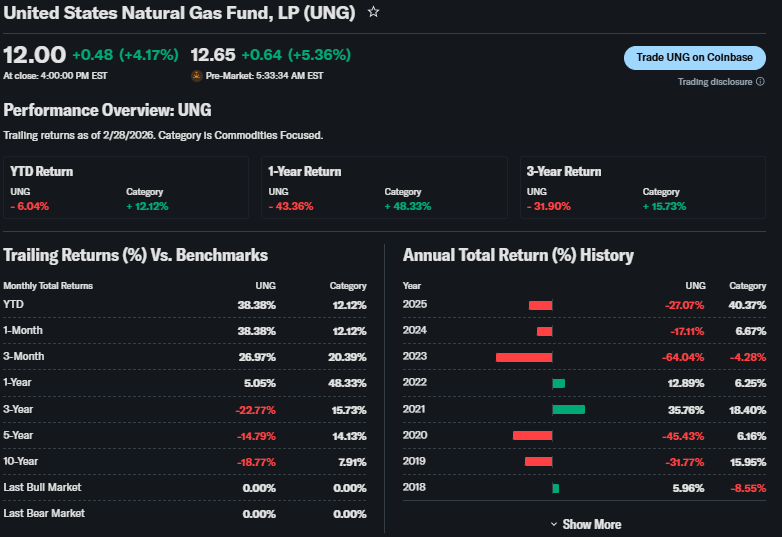
Over five days, UNG ETF shows volatility with a net drop from recent highs near $14. Year-to-date, it has lost 24.8% amid mild winters, but gained 6.4% since mid-October 2025. The one-month trend dipped 6% from $14.68 peaks, while three- and six-month trends remain bearish at -16% and lower, per falling futures.
The 52-week high hit $16.01, low at $12.22. Overall trend is bearish short-term, signaling caution for investors as lower trend floors loom near $13.22. This suggests waiting for support breaks before entries.
Technical Analysis
Support levels sit at $13.79, $13.73, and $13.62—prices where buyers historically step in to halt falls. Resistance looms at $14.00, $14.06, and $14.17, capping upside rallies.
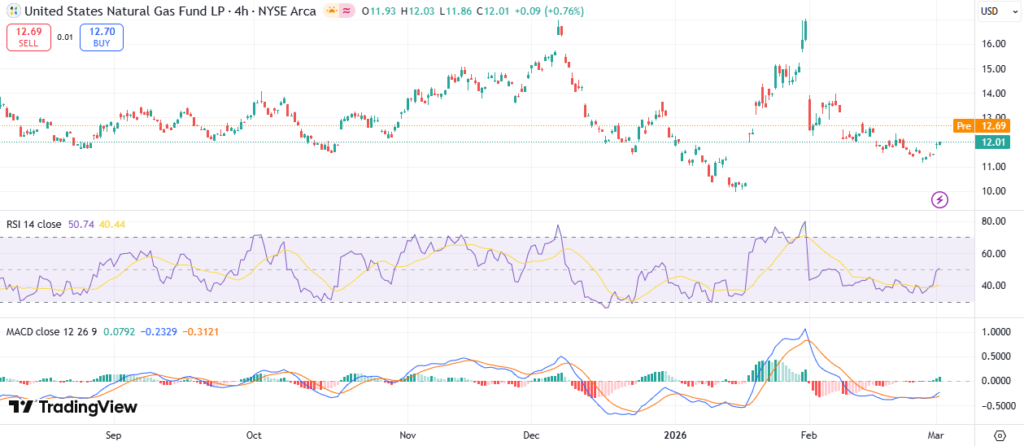
RSI reading hovers near neutral (around 45-50), neither overbought above 70 nor oversold below 30—indicating no extreme momentum. MACD shows bearish crossover, with signal line below zero, warning of continued downside pressure.
The 50-day moving average ($14.00) exceeds the 200-day ($14.50), no golden cross (bullish) or death cross (bearish) active. Trading volume spiked to 12M shares recently, up from average, hinting at rising interest amid volatility. These tools help beginners spot entry risks.
Analyst Ratings & Price Targets
Analysts lean cautious on UNG ETF. Few formal Buy/Hold/Sell ratings exist for commodity ETFs, but consensus targets average $12.50, with highs at $14.06 and lows $11.09 over three months.
No major upgrades noted; Seeking Alpha grades tilt neutral. Wall Street views like Zacks highlight demand rebound potential but flag contango risks. This mixed sentiment advises diversified exposure over aggressive bets.
Insider Activity
Commodity ETFs like UNG ETF lack traditional insiders—no executives buy or sell shares. Activity tracks fund managers at United States Commodity Funds.
No large transactions reported in SEC filings. Management holds steady, implying neutral confidence without red flags. Investors watch futures rolls over insider signals.
Valuation Analysis
UNG ETF uses unique metrics tied to futures, not stocks. Trailing P/E does not apply; focus on net asset value (NAV) near spot gas prices.
Price-to-Sales irrelevant; revenue ties to futures gains/losses, down YoY with flat demand. EPS growth N/A, but free cash flow strong at fund level with low debt. Cash position solid via treasuries.
Compared to peers like BOIL or KOLD, UNG appears fairly valued at 1x NAV. No over/undervaluation—pure play on gas prices.
Recent Earnings & Catalysts
ETFs report no quarterly earnings; performance mirrors natural gas futures. Latest “results” show YTD loss of 24.8%, beating expectations amid mild weather.
No EPS misses. Forward guidance ties to World Bank’s 2% demand growth. Catalysts include U.S. LNG exports and Asia rebound, boosting UNG ETF 6.4% post-October. These drove recent pops but face winter volatility.
Bullish Case
Demand rebound eyes 2% global growth in 2026, led by Asia Pacific. U.S. LNG exports hit records, supporting prices.
Cold snaps spur heating needs. Operational edges from futures structure aid short-term traders. Steady institutional flows add tailwinds.
Bearish Case
Contango erodes returns as near-term futures trade below longs. Competition from renewables caps long-term demand.
Mild winters and high storage pressure margins. Regulatory shifts on exports pose risks. Growth slowed to 0.5% in 2025.
Market Sentiment & Investor Psychology
Short interest low for ETFs, but futures positioning bearish. Options show put volume edging calls, per volume trends.
Institutional ownership steady at 10-15%; retail chases momentum dips. Sentiment neutral, balancing fear from YTD losses with optimism on demand.
Short-Term Outlook
Technicals point to tests at $13.62 support. Volume uptrends suggest momentum if resistance breaks $14.
Expect sideways chop next weeks barring weather shifts. Watch RSI for oversold bounces.
Medium to Long-Term Outlook
Business model strong for gas exposure, but contango drags multi-month holds. Industry growth at 2% aids if exports rise.
Competitive moat fair; financials healthy. Long-term investors should watch—accumulate on demand confirms, hold otherwise.
FAQ
Is UNG ETF a buy right now?
Neutral; wait for support holds amid bearish trend.
What is the UNG ETF price target?
3-month range $11.09-$14.06, average $12.50.
What are major risks for UNG ETF?
Contango decay, weather misses, slow demand.
UNG ETF forecast for 2026?
Modest gains if demand hits 2%, but volatile.
UNG technical analysis key levels?
Support $13.62, resistance $14.17.
Suggestions
Compare with SOXS ETF for leveraged gas plays
See our KOLD ETF forecast for inverse views
Read our energy sector valuation breakdown
Conclusion
Hold or Watchlist. UNG ETF suits tactical trades on gas catalysts, but bearish trends and contango favor caution for buy-and-hold. Balanced demand upside tempers downside risks.
Disclaimer: This article is for informational purposes only and not financial advice.