
TZA ETF analysis covering TZA ETF price trend, forecast, technical analysis, risks, and outlook to help investors evaluate whether TZA ETF is a buy.
Introduction
Direxion Daily Small Cap Bear 3X Shares (TZA ETF) is a leveraged exchange-traded fund that seeks daily investment results equal to three times the inverse performance of the Russell 2000 Index. In simple terms, the TZA ETF goes up when small-cap U.S. stocks in the Russell 2000 go down, and it goes down when those stocks rise.
Investors focus on the TZA ETF when they expect weakness or turbulence in small-cap equities, or when they want to hedge portfolios with significant exposure to small-cap growth names. Recent volatility in interest rates, concerns about economic growth, and shifting expectations around Federal Reserve policy have pushed many traders to consider tactical bearish vehicles like the TZA ETF. Because this is a 3x inverse product, it is aimed at short-term traders rather than long-term buy‑and‑hold investors.
Broader market conditions remain mixed, with large-cap indices near recent highs while small caps have lagged and shown sharp swings. That divergence keeps the TZA ETF relevant for investors seeking to express a view on the relative weakness of small‑cap stocks.
Latest ETF Price & Trend
At the latest close, the TZA ETF price was about 6.23 USD per share, trading in after‑hours status following the U.S. market close. This was up roughly 0.30 USD from the previous close near 5.93 USD, reflecting a strong single‑day gain of just over 5 percent. In other words, the most recent session was positive for holders of the TZA ETF, consistent with a down day for the underlying small‑cap index.
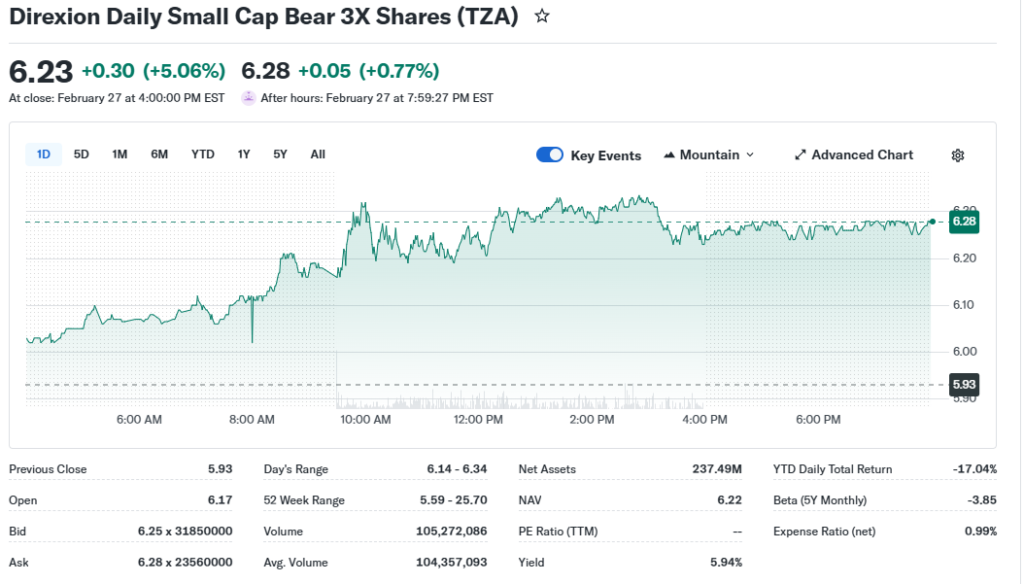
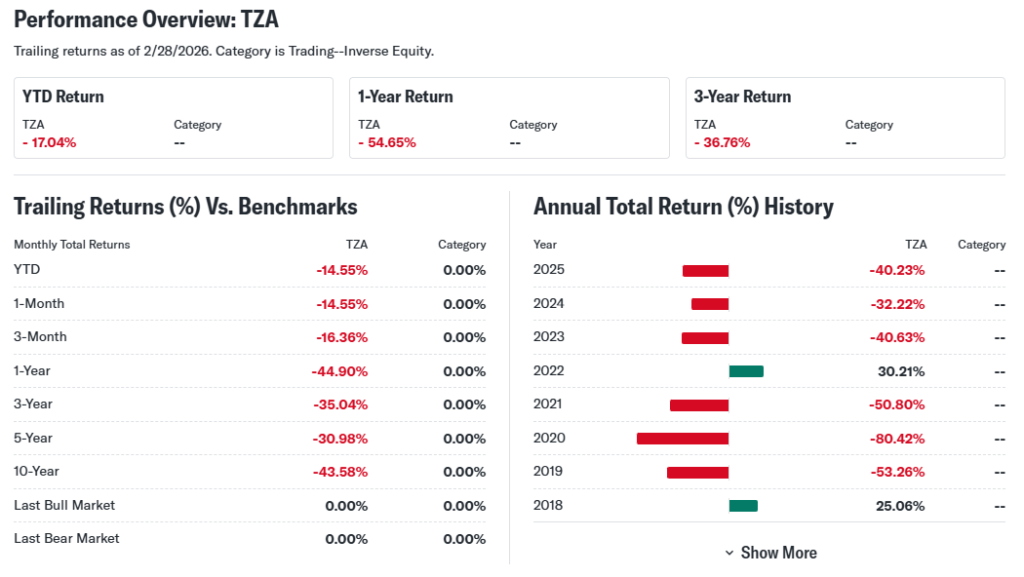
Over the past 5 trading days, performance has been slightly negative, with the TZA ETF down roughly 2.6 percent, suggesting choppy short‑term trading conditions. The 1‑month performance shows a much steeper decline of about 16 percent, indicating that small‑cap stocks have generally been rising over that horizon and pushing the TZA ETF lower. Over 3 months, the TZA ETF has dropped by more than 40 percent, a sharp downtrend that underlines sustained strength in the Russell 2000 during that period.
On a 6‑month basis, the TZA ETF is down around 7 percent, while the approximate 1‑year performance decline is near 21 percent. The fund’s 52‑week high is close to 25.70 USD, while the 52‑week low is about 5.59 USD, placing the current TZA ETF price near the lower end of that range. Overall, the trend in the TZA ETF remains decisively bearish, meaning the underlying small‑cap market has been generally bullish over these periods, and TZA has been losing value as a result.
For investors, this long slide suggests that using the TZA ETF as a long-term position has been costly, reinforcing its design as a short‑term tactical hedge or trading instrument rather than a core holding.
Technical Analysis
Technical analysis of the TZA ETF helps traders understand where short‑term price battles might take place. A support level is a price area where buyers have historically stepped in, slowing or reversing declines. For the TZA ETF, recent price action around the 6 USD area suggests near‑term support, with the 52‑week low around 5.59 USD representing a deeper support zone that traders watch closely.
A resistance level is where selling pressure tends to appear. Given the TZA ETF’s sharp decline, recent resistance has likely formed at prior rebound points in the high‑single‑digit to low‑double‑digit range, with previous breakdown zones near 10–13 USD acting as potential upside resistance if a short‑term rally develops. When price approaches these areas, traders often anticipate more difficult progress for further gains.
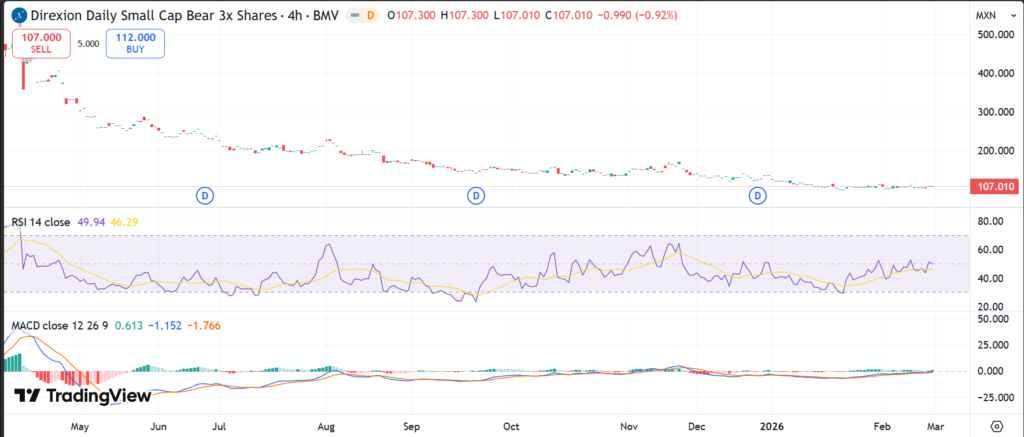
The 50‑day moving average (50‑DMA) and 200‑day moving average (200‑DMA) show the prevailing intermediate and long‑term trends. Recent calculations place the 50‑DMA near 13.06 USD and the 200‑DMA around 13.64 USD, both well above the current TZA ETF price. This configuration indicates that price is trading meaningfully below both key moving averages, a sign of persistent downside momentum in TZA and strength in the underlying small‑cap market. Because the 50‑DMA is also below the 200‑DMA, the pattern resembles a death cross, which in simple terms reflects a bearish trend for the ETF itself.
Indicators such as the Relative Strength Index (RSI) and MACD help gauge momentum, but detailed real‑time readings require live chart data from platforms like Yahoo Finance, Nasdaq, or MarketWatch. These tools typically flag RSI readings above 70 as overbought and below 30 as oversold, while MACD crossovers highlight shifts in momentum, yet given the very strong downtrend in TZA, momentum indicators have likely favored persistent downside pressure rather than a sustained bullish reversal. Trading volume has been heavy, with recent daily volume around 105 million shares, roughly in line with or above the average volume near 104 million shares, reinforcing that many traders are actively using the TZA ETF as a short‑term instrument.
Analyst Ratings & Price Targets
Because the TZA ETF is a leveraged inverse ETF designed for very short holding periods, it typically does not receive traditional analyst coverage with Buy/Hold/Sell ratings or long‑term price targets in the way that individual stocks do. Major research platforms like Yahoo Finance, Nasdaq, and MarketWatch tend to focus formal ratings on underlying companies and broad ETFs rather than on highly tactical leveraged products.
As a result, data for the number of Buy, Hold, or Sell ratings on the TZA ETF, as well as average, high, and low price targets, is minimal or not provided in standard analyst coverage feeds. Investors should therefore not expect a conventional “Is TZA ETF a buy” conclusion from Wall Street firms, since these products are generally treated as trading tools rather than investment recommendations.
In practice, analyst sentiment around the TZA ETF is best inferred from their views on U.S. small‑cap stocks and the Russell 2000 Index, rather than from direct ETF‑specific ratings.
Insider Activity
Leveraged ETFs such as the TZA ETF do not have corporate insiders in the same way that operating companies like Microsoft or Zoom do. There are no executives with large stock option grants whose buying and selling would be reported as insider transactions under SEC rules. Instead, the ETF is managed by Direxion, which adjusts underlying derivatives and cash positions to deliver the targeted daily leveraged exposure.
Therefore, traditional insider buying, insider selling, and large insider stock transactions do not apply to the TZA ETF in the conventional sense. There is no meaningful management share‑activity trend that can be used as a signal of confidence or caution for investors. For this type of product, investors should focus more on liquidity, tracking behavior, and the outlook for the underlying index rather than insider activity.
Valuation Analysis
Valuation metrics like trailing price‑to‑earnings (P/E), forward P/E, price‑to‑sales, and free cash flow are usually applied to operating businesses that generate revenues and earnings. The TZA ETF is a trading vehicle that uses swaps and derivatives tied to the Russell 2000, so standard valuation ratios from company earnings do not meaningfully apply.
Fund data shows no conventional earnings per share or P/E ratio for the TZA ETF because it does not produce operating revenues or profits in the manner of a company. Instead, its performance is engineered to provide -3x daily returns of the Russell 2000 Index, with holdings largely in index swaps and cash equivalents rather than productive assets. Comparing the TZA ETF valuation to large technology companies such as Microsoft or growth platforms like Zoom is therefore not appropriate, since those firms have real revenue growth, EPS, and free cash flow, while TZA does not.
Given this structure, it is not accurate to label the TZA ETF as undervalued, fairly valued, or overvalued based on traditional valuation multiples. Its “value” is tied to how effectively and efficiently it provides inverse leveraged exposure to the Russell 2000, including factors such as tracking error, fees, and path‑dependent decay over time, rather than a fundamental earnings‑based valuation.
Recent Earnings & Catalysts
The TZA ETF does not publish quarterly earnings reports like a corporation. There are no revenue or EPS figures to compare with Wall Street expectations, no formal forward guidance, and no earnings calls discussing operational performance. Instead, the key “catalysts” for the TZA ETF are macro and market‑level developments affecting U.S. small‑cap stocks.
Important drivers include changes in interest‑rate expectations, economic growth data, risk appetite for small‑cap and speculative stocks, and any shifts in policy that affect domestic‑oriented businesses. For example, stronger‑than‑expected economic data that lifts small‑cap stocks will usually pressure the TZA ETF lower, as reflected in its negative returns over the last 3–12 months, while risk‑off episodes, weak data, or tightening financial conditions can fuel short‑term spikes in the TZA ETF price.
There are no AI integrations, product launches, or partnerships in the corporate sense, since this is a structured financial product rather than an operating company.
Bullish Case
The bullish case for the TZA ETF centers on scenarios where U.S. small‑cap stocks face significant headwinds. If economic growth slows, credit conditions tighten, or risk appetite for smaller, more volatile companies evaporates, the Russell 2000 could decline, pushing the TZA ETF sharply higher by design. Periods of market stress or sharp corrections in small caps can lead to very large short‑term gains in leveraged inverse products.
Another positive driver for TZA ETF holders is elevated volatility. When markets swing widely, traders sometimes use the TZA ETF both as a hedge and as a pure trading vehicle, which can amplify short‑term moves and bring strong liquidity and volume. In such environments, technically focused traders may see attractive “Is TZA ETF a buy” setups for intraday or multi‑day trades, especially near perceived support levels.
Because the TZA ETF is already near its 52‑week low, a meaningful reversal in small caps could produce a sizable percentage rebound in TZA, given its 3x inverse structure.
Bearish Case
The bearish case for the TZA ETF is straightforward: it loses value when small‑cap stocks rise. Over the last several months, the sharp negative performance of the TZA ETF reflects strong gains in the Russell 2000, showing how costly it can be to hold TZA during a bull phase in small caps. If small‑cap earnings, revenue growth, and risk sentiment remain healthy, the TZA ETF may continue to drift lower or experience sharp declines.
A key structural risk is compounding decay. Because the TZA ETF is rebalanced daily to target -3x returns, holding it for extended periods can lead to returns that diverge significantly from the simple inverse of the index, especially in volatile sideways markets. This makes long‑term holding risky even if the broad direction is favorable, and it complicates any long‑term “TZA ETF forecast” based on simple index moves.
Regulatory changes affecting leveraged and inverse ETFs, as well as any liquidity or counterparty issues in the derivatives used, are additional risks that investors should consider.
Market Sentiment & Investor Psychology
Market sentiment around the TZA ETF reflects broader investor psychology toward small‑cap risk. While specific figures for short interest in the ETF itself are less central than for single stocks, options activity and trading volume can reveal whether traders are aggressively positioning for downside in small caps. Heavy volume around recent lows indicates that traders are actively using the TZA ETF for tactical bets and hedges.
Institutional investors often use futures and options on small‑cap indices rather than leveraged ETFs for large hedges, so institutional ownership patterns in TZA can be less informative than for standard ETFs. Retail traders, by contrast, are more likely to use the TZA ETF for short‑term directional bets, often driven by fear or attempts to time pullbacks in overheated markets. Overall sentiment currently appears cautious to neutral, with the ETF’s continued decline signaling that the prevailing bias favors small‑cap strength rather than broad fear.
Short-Term Outlook
In the short term, the TZA ETF outlook depends heavily on near‑term moves in the Russell 2000 and broader risk sentiment. Technical conditions show price trading significantly below both the 50‑day and 200‑day moving averages, highlighting a strong downward trend for the ETF itself. This means that, unless small‑cap stocks face a notable pullback, the path of least resistance for the TZA ETF may remain sideways to lower.
However, because this is a 3x inverse product, any brief correction in small‑cap stocks could produce sharp, fast rallies in the TZA ETF, especially from levels near the 52‑week low. Traders focused on TZA ETF technical analysis will likely watch support near recent lows and resistance around prior reaction highs for short‑term opportunities, but should avoid assuming a sustained trend reversal without confirmation from the underlying index.
Medium to Long-Term Outlook
Over a 6–24 month horizon, the TZA ETF is not designed to be a core holding for most investors. Its daily rebalancing and leveraged inverse structure make long holding periods risky and potentially inefficient, even if small‑cap stocks eventually decline. The longer the holding period, the more path dependency and compounding distort the relationship between index returns and ETF performance.
The fundamental business model strength of TZA lies in its ability to provide targeted, liquid, short‑term exposure to a specific bet: that small‑cap stocks will fall. Industry growth for small‑cap companies, improving balance sheets, and supportive macro conditions would all work against long‑term holders of TZA, while only sustained, deep weakness in the Russell 2000 would benefit them.
Given these characteristics, long‑term investors are generally better served to treat the TZA ETF as a watchlist or tactical tool rather than a long‑term accumulation vehicle. For most, a reasonable stance is to watch and potentially use TZA in short bursts during periods of perceived small‑cap overvaluation or rising macro risks, rather than holding it for 6–24 months.
FAQ Section
- Is TZA ETF a buy right now?
The TZA ETF may be attractive only for traders who expect near‑term downside in U.S. small‑cap stocks and understand the risks of leveraged inverse ETFs; it is generally not suitable as a long‑term investment. - What is the current TZA ETF price?
The latest TZA ETF price is about 6.23 USD per share, near the lower end of its 52‑week range between roughly 5.59 USD and 25.70 USD. - What is the TZA ETF forecast?
There is no formal long‑term TZA ETF forecast from major analysts; its returns will depend mainly on the direction and volatility of the Russell 2000 Index and broader macro conditions. - Does TZA ETF have earnings or a P/E ratio?
No, the TZA ETF does not generate operating earnings, so traditional metrics like P/E, EPS growth, or free cash flow do not apply in the same way they do for operating companies. - What are the major risks of holding the TZA ETF long term?
Key risks include sustained strength in small‑cap stocks, compounding decay from daily rebalancing, and potential divergence from the simple inverse of the index over long periods.
Suggestions
You could internally link to related pieces such as:
“Compare with SOXS ETF alternatives” for investors weighing bullish versus bearish small‑cap funds.
“See our Russell 2000 outlook and forecast” to provide more context on the index that drives TZA performance.
“Read our leveraged ETF risk guide” to explain how daily rebalancing and path dependency affect long‑term returns.
Conclusion
The TZA ETF is a specialized, high‑risk tool for expressing a short‑term bearish view on U.S. small‑cap stocks, not a traditional investment for long‑term portfolios. With the TZA ETF price near its 52‑week low and well below key moving averages, recent performance has strongly favored small‑cap bulls and punished long TZA holders.
Given its structure, lack of fundamental earnings, and vulnerability to compounding decay, a prudent stance for most investors is Watchlist / tactical use only, reserving TZA for short‑duration hedges or speculative trades when the Russell 2000 appears vulnerable. Long‑term buy‑and‑hold investors should be cautious when asking, “Is TZA ETF a buy?”, and instead focus on diversified, non‑leveraged vehicles unless they fully understand and accept the added risk.
Disclaimer: This article is for informational purposes only and not financial advice.