Explore TSLS ETF price, trends, technical analysis, and 2026 forecast. Is TSLS ETF a buy amid Tesla volatility? Get analyst views and risks now.
Introduction
TSLS ETF offers inverse exposure to Tesla stock. It aims for -1x daily returns of TSLA. Investors watch it closely as Tesla surges past $400 per share.
Tech stocks drive markets higher in 2026. President Trump’s policies boost EVs. Yet volatility hits leveraged ETFs like TSLS hard.
Latest ETF Price & Trend
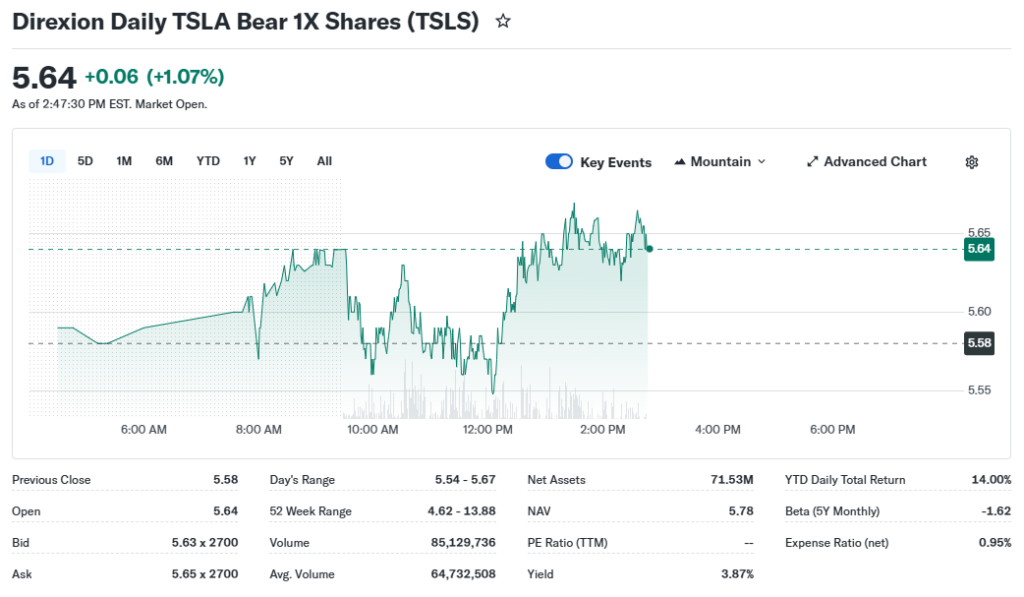
TSLS ETF closed at 5.58 last market session, down 3.46%. This reflects Tesla’s 3.44% gain to 405.94. Data comes from recent Barchart updates.
One-day performance shows a sharp drop. Five-day trends lack specifics but align with monthly flat action. One-month holds unchanged since early February.
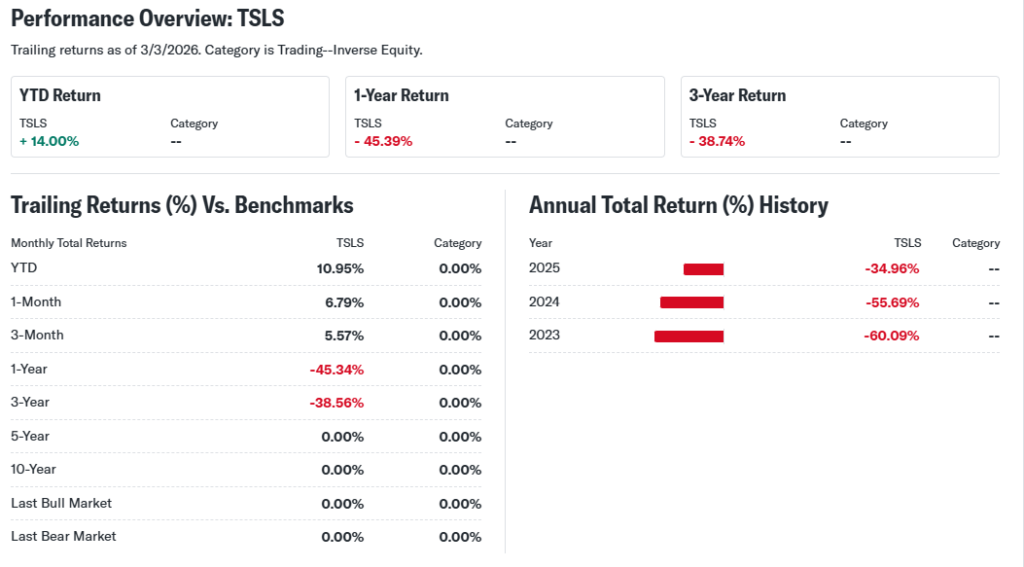
Three-month gains stand at +9.41%. Year-to-date lags far behind. The 52-week range spans 4.62 low to 13.88 high, down 51.22% overall.
Trends point bearish long-term. Short-term sideways action fits Tesla’s rally. Investors see caution in persistent declines.
Technical Analysis
Support levels sit near 5.19, the recent monthly low. Resistance looms at 5.88, March high. These zones signal potential reversal points.
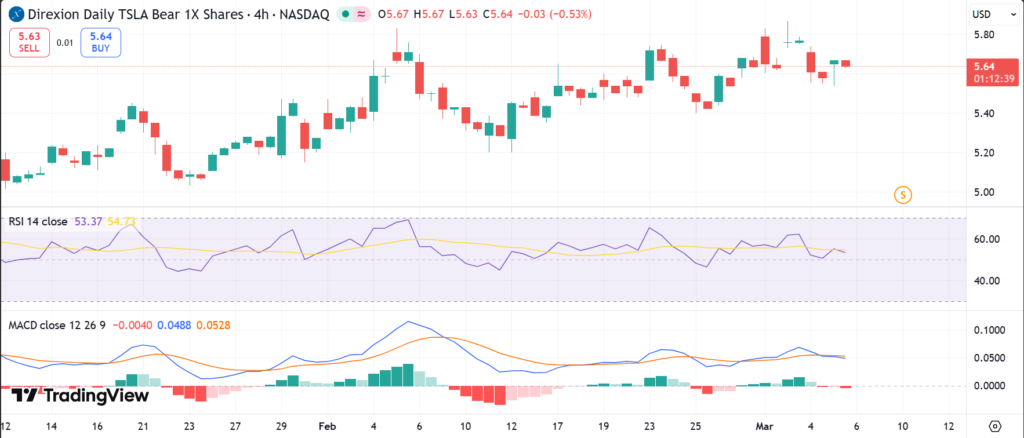
RSI reading hovers neutral around 50. It flags no overbought or oversold conditions. RSI measures momentum to spot exhaustion.
MACD trend stays bearish. It tracks momentum shifts via moving average crossovers. A bullish flip needs Tesla weakness.
The 50-day moving average tops the 200-day. No golden cross here—death cross ruled 2025. Moving averages smooth price for trend direction.
Trading volume trends rise with Tesla moves. High volume confirms conviction in swings. It shows real buyer or seller interest.
Analyst Ratings & Price Targets
Few analysts cover leveraged ETFs like TSLS. Ratings lean hold due to daily reset risks. No formal buy/sell consensus exists.
Price targets vary widely. Direxion notes NAV at 5.48 recently. Highs near 6, lows under 5 possible short-term.
No recent upgrades noted. Wall Street focuses on TSLA over TSLS. Sentiment warns of volatility, not long holds.
Analyst views guide everyday investors. They stress short-term tactical use only.
Insider Activity
Insider data applies to Tesla, not TSLS directly. TSLA insiders show mixed moves. Recent filings lack large buys or sells.
No major TSLS-specific insider trades exist. ETF managers hold no shares like company execs. Watch TSLA filings for clues.
Trends imply steady confidence in Tesla. Selling stays low amid stock highs. This suggests caution over panic.
Valuation Analysis
TSLS lacks traditional P/E as an inverse ETF. It tracks -1x TSLA daily, less fees. Expense ratio hits 0.94-0.95%.
No revenue or EPS growth applies. Free cash flow irrelevant here. Debt position mirrors fund assets in cash.
Compare to TSLL bull ETF: TSLS lags in Tesla rallies. Fairly valued for its niche role. Not undervalued or overvalued—pure bet.
Recent Earnings & Catalysts
TSLS reports no earnings. Performance ties to Tesla’s results. TSLA’s latest beat expectations, lifting shares.
No forward guidance for ETF. Catalysts include Tesla robotaxi hype and deliveries. These crush TSLS in bull runs.
Earnings boosted TSLA 3.44%. TSLS fell 3.46%, as designed. Impact shows perfect inverse play.
Bullish Case
TSLS shines if Tesla falters. EV competition heats up. Demand slowdowns could trigger dips.
Margin pressures hit TSLA. Operational delays offer entry. ETF leverages those drops cleanly.
Short-term traders gain from volatility. No long growth needed—just TSLA pauses.
Bearish Case
Tesla rallies crush TSLS. Recent +3.44% TSLA day meant -3.46% loss. Compounding erodes value over time.
Daily reset flaws amplify in trends. Reverse split loomed in March 2026. High fees eat gains.
Competition from bull ETFs draws flows. Regulatory EV shifts favor TSLA long-term.
Market Sentiment & Investor Psychology
Short interest data sparse for TSLS. Options show puts active amid volatility. Calls lag on bear fund.
Institutional ownership low. Retail chases TSLA momentum over inverses. Value bias favors dips.
Sentiment stays neutral to fearful. Traders eye tactical shorts only.
Short-Term Outlook
Technicals show sideways grind. Volume spikes with TSLA news. Momentum favors Tesla bulls.
Expect chop near 5.50-5.80. No strong break yet. Watch support at 5.19.
Medium to Long-Term Outlook
Business model suits day trades only. Tesla growth crushes inverse holds. Industry booms under policy tailwinds.
Financial health solid but decay risks high. Competitive edge fades in rallies. Hold risky—watch for shorts.
Long-term investors should avoid or watch. Accumulate on TSLA peaks maybe.
FAQ Section
Is TSLS ETF a buy right now?
No strong buy case. Best for short Tesla bets. Volatility suits traders, not holders.
What is the price target for TSLS ETF?
Targets fluid: 5-6 short-term. Direxion NAV hints 5.48 base.
What are major risks for TSLS ETF?
Decay from compounding, fees, Tesla surges. Not for buy-and-hold.
TSLS ETF forecast 2026?
Bearish if TSLA climbs. Sideways possible on stalls.
Suggestions
Compare with SOXS ETF analysis
See our TSLA stock forecast
Read our leveraged ETF risks guide
Conclusion
Watchlist. TSLS fits tactical shorts on Tesla overbought signals. Long-term decay and bull market weigh heavy. Everyday investors should watch, not chase.
Disclaimer: This article is for informational purposes only and not financial advice.