
TQQQ Technical Analysis: March 2026 Bearish Momentum & Support Levels
TQQQ, the ProShares UltraPro QQQ ETF, seeks 3x the daily return of the Nasdaq-100 Index, making it a go-to for traders betting on tech-heavy growth in sectors like technology, communications, and consumer discretionary. With holdings dominated by leaders such as NVIDIA, Apple, and Microsoft, it amplifies Nasdaq moves, drawing attention during AI booms and policy shifts.
In March 2026, traders eye TQQQ amid recent downside pressure from momentum shifts, Middle East tensions impacting risk assets, and mixed economic signals like inflation worries—despite year-to-date gains around 31%. This article covers the short-term trend, support/resistance, RSI/MACD/volume signals, and outlook to equip retail traders with educational insights.
Current Price Trend in March 2026
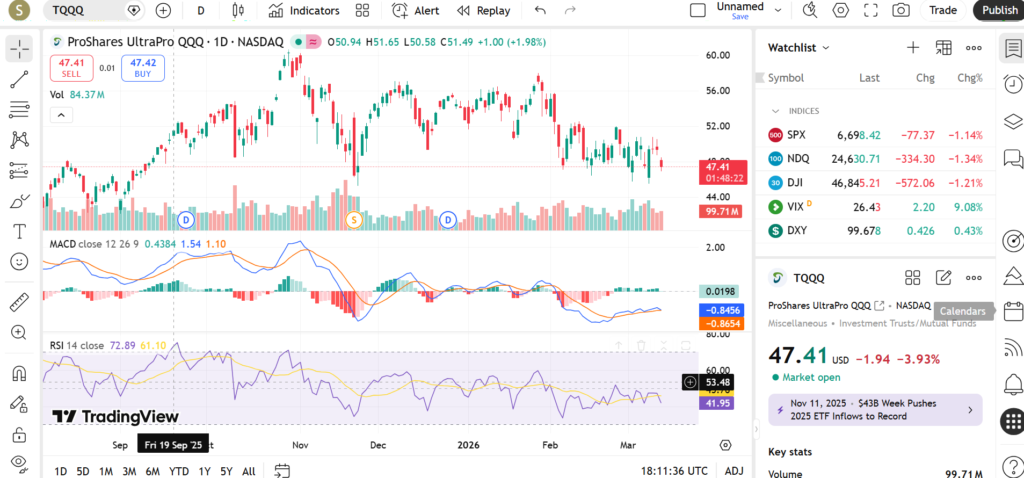
TQQQ entered a short-term downtrend in early March 2026, with price action breaking below recent ranges after testing highs near $51-52 from February. Recent swings show a higher high in late February followed by a sharp pullback, now trading around $49 amid declining closes, as the 10-day MA crossed bearishly under the 50-day MA earlier in the month.
Moving averages reflect caution: the 20-day MA hovers near recent pivots, while the 50-day provides nearby support but the 200-day lags lower, signaling potential for further tests if Nasdaq weakens. This educational pattern—volume-supported declines—highlights how leveraged ETFs like TQQQ exaggerate index corrections without implying reversals.
Key Support and Resistance Levels
Key supports act as potential buying interest zones, often prior lows or statistical bands.
- Primary Support at $47.40 (1-day std dev lower band / recent volume cluster): Derived from 20-day volatility, this level near February lows could attract dip-buyers if held; a break might accelerate toward $46.50 gaps.
- Secondary Support near $46.58 (double-bottom / MA confluence): Aligns with accumulated volume and prior swing lows, significant for halting multi-day drops in leveraged tech plays.
- Tertiary Support around $45 (round number / Q1 pivot): Psychological level with option strike interest, where deeper Nasdaq pullbacks have found bids historically.
Resistances loom as sell zones from recent action.
- Primary Resistance at $51.41 (1-day std dev upper band / swing high): Recent rejection point with profit-taking; close above could signal rebound to $52 February closes.
- Secondary Resistance near $52 (50-day MA extension / prior monthly close): February 2026 level ($49.52 monthly? Wait, adjust: late Feb high), key for trend shift if reclaimed.
- Upper Resistance at $54 (January pivot / channel top): Aligns with early 2026 highs, a breakout target on strong tech catalysts.
Breaks matter: below $47.40 might indicate deeper correction signaling put exploration or shorts, while above $51.41 could flip momentum bullish, targeting secondaries—traders watch closes for confirmation.
Indicators – RSI, MACD, Volume
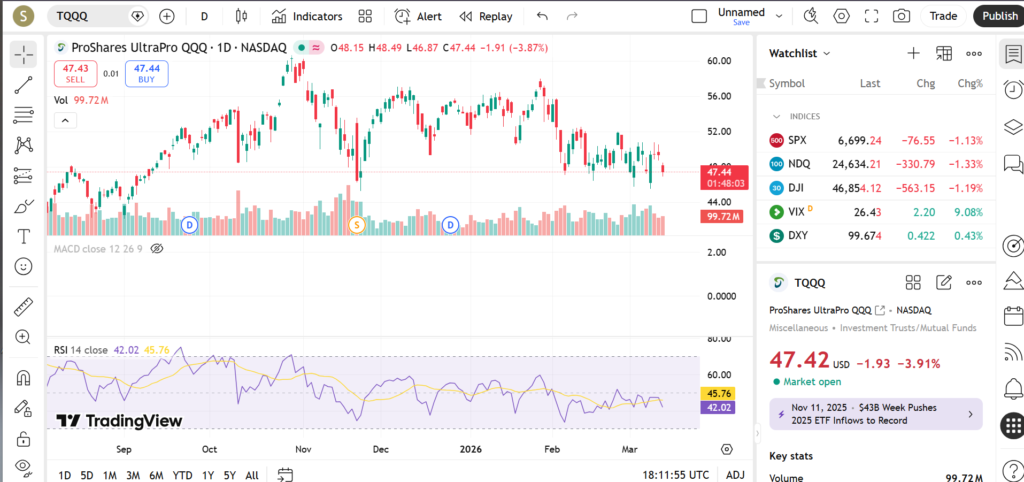
RSI (14-period) leans neutral around 50-55 on daily charts through mid-March 2026, exiting oversold briefly but not overbought, leaving room for swings without extreme signals; 4H dips near 40 have prompted bounces historically.
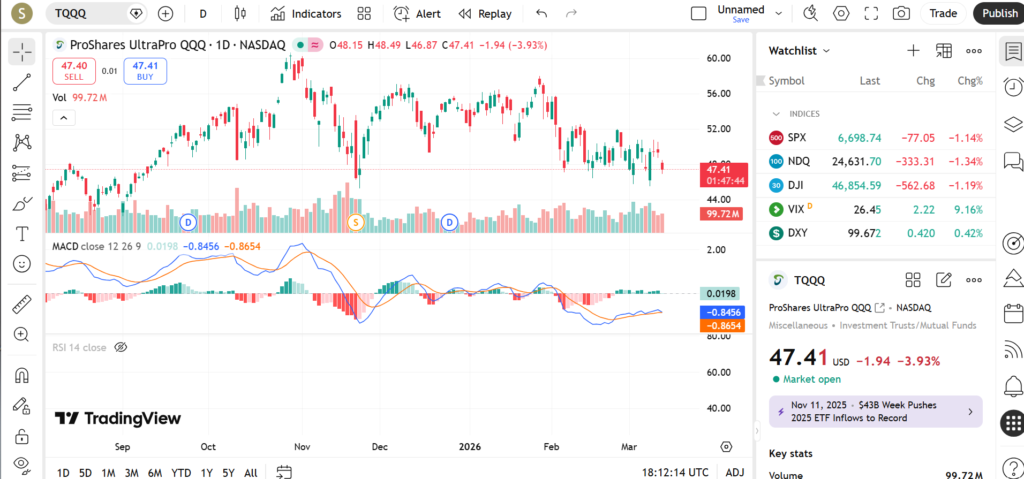
MACD shows mixed signals: positive turn in late February supported early gains, but histogram fading with momentum below 0 by March 10 hints at bearish divergence, warranting watches for line cross below signal.
Volume spiked on declines (e.g., 79M+ shares March 11), higher than average 55-65M, indicating distribution rather than capitulation, with lighter reads on minor rebounds—common in downtrends for TQQQ’s high-beta profile.
Short-Term Outlook for TQQQ in March 2026
TQQQ’s March 2026 technicals point to downside bias, with downtrend confirmed below 50-day MA, negative momentum, and volume on weakness outweighing neutral RSI/MACD—though oversold bounces remain possible on Nasdaq relief. Support cluster near $47 offers first test, but sustained breaks could extend pullbacks amid macro risks.
- What traders are watching:
- $47.40 support hold or breach on Middle East news/oil volatility impacting risk-off flows.
- $51.41 resistance reclaim amid Fed CPI data or Trump policy on tech/AI incentives.
- MACD bearish crossover confirmation; RSI drop below 40 for oversold setups.
- Nasdaq-100 earnings from semis (NVIDIA) versus broader recession signals.
- Volume spikes: rising on upside for reversal clues, sustained high on downs for continuation.
Risks and Important Notes
Even clear levels like $47.40 can break on surprises such as escalated Iran conflicts, hotter CPI prints, or tech earnings flops, amplified by TQQQ’s 3x leverage which turns mild Nasdaq dips into sharp moves. Unexpected volume surges or policy U-turns often invalidate patterns quickly.
Stay educational: use this for pattern recognition, pair with stops and sizing suited to your account—technical analysis aids decisions but doesn’t predict news-driven gaps.
Track TQQQ with peers like QLD (2x Nasdaq) or SOXL (semis 3x) for context. Explore our SOXL or UPRO analyses for sector/diversified leverage views, and bookmark for real-time March 2026 updates.