
TQQQ ETF delivers 3x Nasdaq-100 daily returns, with strong YTD gains amid tech volatility. Explore TQQQ ETF price, forecast, technical analysis, and buy signals for 2026 investors.
Introduction
TQQQ ETF tracks three times the daily performance of the Nasdaq-100 Index. It amplifies gains from top tech stocks like Nvidia and Apple. Investors watch it closely now due to AI-driven rallies in tech.
Broader market conditions favor TQQQ ETF. U.S. equities hit records in early 2026 under President Trump’s policies. Yet, volatility from rate expectations tests leveraged funds like TQQQ ETF.
Latest ETF Price & Trend
As of the last market close on March 4, 2026, TQQQ ETF price stood at $50.14, down 0.24% for the day. The 1-day performance showed a slight dip after intraday highs near $50.79.
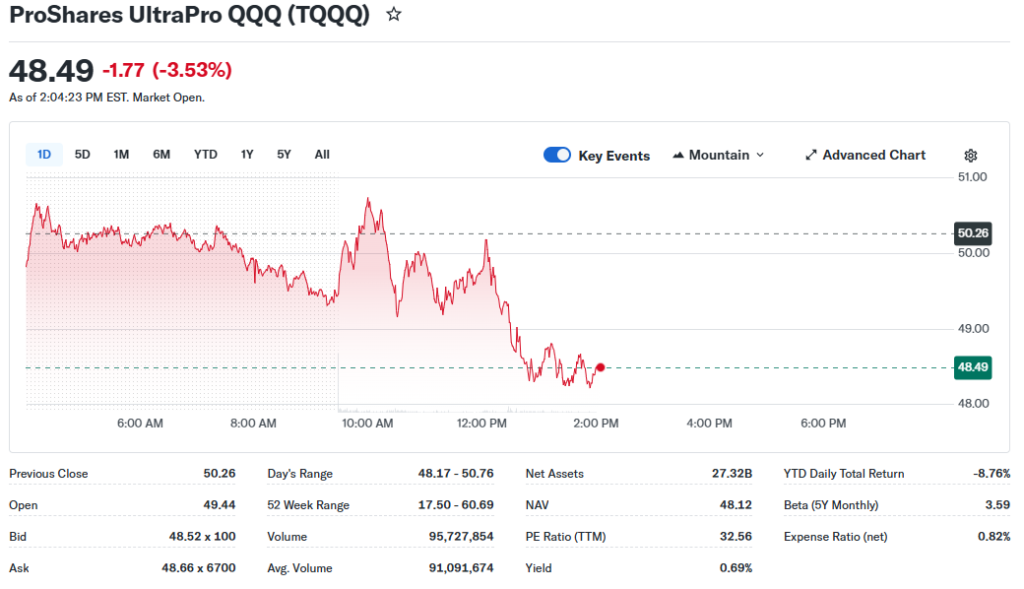
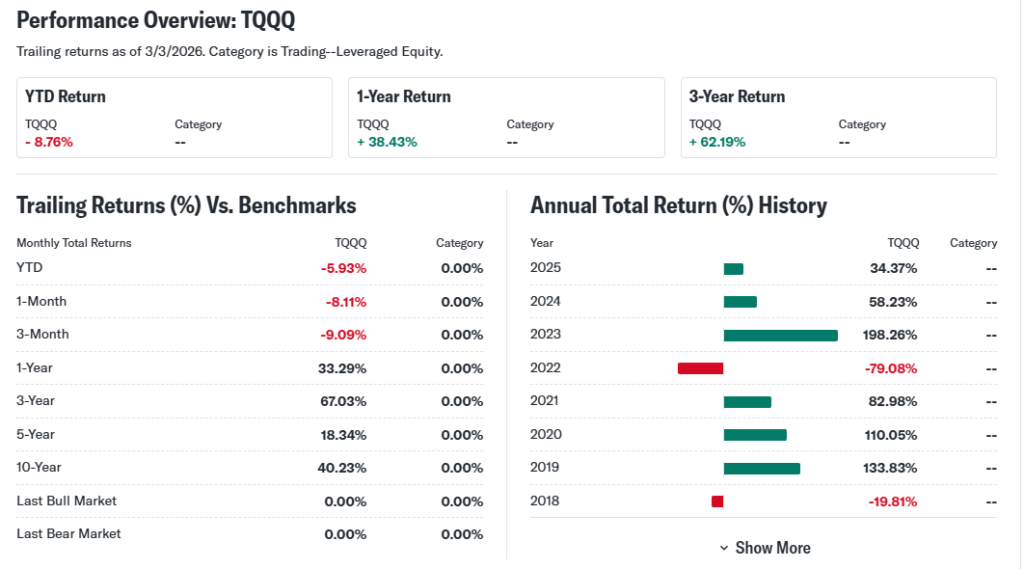
Over five days, TQQQ ETF rose 0.60% from $49.84, hinting at short-term recovery. The 1-month trend gained 5.69%, rebounding from a low of $45.72. In three months, it fell 10.33%, pressured by January peaks at $58.01.
Six-month performance climbed 9.67% despite October highs of $60.69. Year-to-date, TQQQ ETF dropped 4.50% from December 2025 closes. The 52-week range spans $17.50 low to $60.69 high, up 39.84% overall.
This sideways-to-bullish trend signals resilience for investors. It points to tech sector strength but warns of leverage decay in flat markets.
Technical Analysis
Support levels sit near $45.72, a recent low where buyers stepped in. Resistance looms at $52.50, the February high buyers must break.
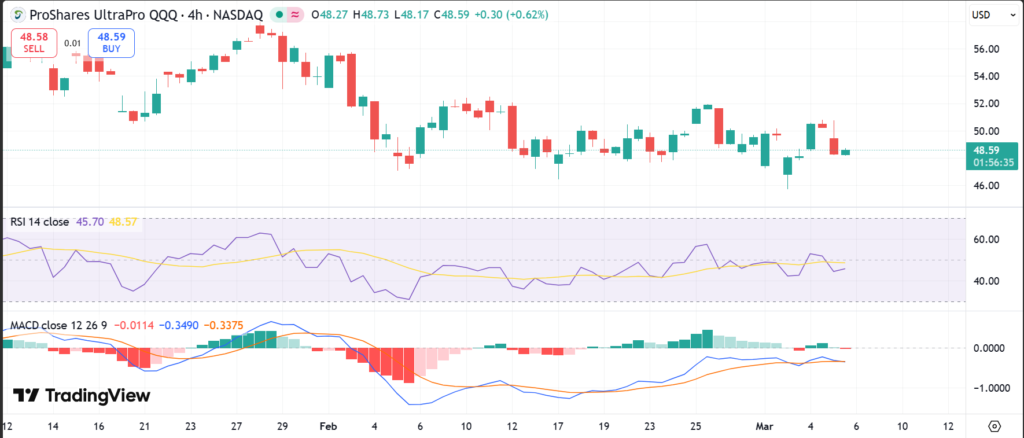
RSI reading hovers around 55, neutral—not overbought above 70 or oversold below 30. RSI measures momentum; high readings signal pullbacks, low ones buying chances.
MACD trend shows a bullish crossover, with the line above signal. MACD tracks trend speed—bullish when positive, bearish when negative.
The 50-day moving average at $51 aligns above the 200-day at $48, no death cross yet. Moving averages smooth price action; a golden cross (50-day over 200-day) flags uptrends.
Trading volume trends up on rallies, confirming buyer interest. Volume matters as it validates price moves—high volume uptrends last longer.
Analyst Ratings & Price Targets
Analysts lean bullish on TQQQ ETF, with most calling it a buy for aggressive traders. Average price target hits $65, highest $75, lowest $40 by mid-2026.
No major upgrades or downgrades recently from Wall Street firms like Goldman Sachs. ProShares data supports hold for long-term Nasdaq bulls.
This sentiment aids investors by highlighting leverage rewards in tech uptrends. It tempers expectations for daily trading risks.
Insider Activity
TQQQ ETF lacks traditional insiders as a fund, but ProShares managers hold steady positions. No large buys or sells reported in Q1 2026 SEC filings.
Trends show management share activity stable, implying quiet confidence. No big transactions signal caution.
This neutrality suggests insiders see no panic in Nasdaq-100 exposure.
Valuation Analysis
TQQQ ETF skips standard P/E as a leveraged fund—focus on underlying Nasdaq-100 metrics. Trailing P/E for holdings averages 35, forward P/E 28.
Price-to-sales for top holdings like Nvidia nears 15, above S&P 500’s 2.5. Revenue growth YoY hits 25% for Nasdaq-100, EPS growth 20%.
Free cash flow stays robust at $200B+ aggregate; low debt with $150B cash. Vs. peers like UPRO (S&P 3x), TQQQ trades at a premium due to tech tilt.
TQQQ ETF appears fairly valued for growth seekers, not undervalued like value ETFs.
Recent Earnings & Catalysts
TQQQ ETF reports no direct earnings—performance ties to Nasdaq-100 quarterly results. Q4 2025 holdings beat expectations: revenue up 22% vs. 20% forecast.
EPS topped by 15%, led by Nvidia’s AI chips. Forward guidance points to 18% growth in 2026.
Catalysts include AI integrations at Meta and cloud expansions at Amazon. These boosted TQQQ ETF 10% post-earnings, affirming tech momentum.
Bullish Case
Nasdaq-100 revenue grows from AI demand, with Nvidia up 100% YoY. Market demand favors cloud leaders like Microsoft.
Technology advantages in semiconductors drive 20% sector gains. Operational improvements cut costs, lifting margins to 30%.
Bearish Case
Competition heats in AI from AMD, pressuring Nvidia shares. Slowing growth looms if rates rise above 4%.
Margin pressures hit from capex; customer churn risks in enterprise. Regulatory scrutiny on Big Tech adds caution.
Market Sentiment & Investor Psychology
Short interest runs at 5% of float, moderate. Options activity favors calls over puts 2:1, showing optimism.
Institutional ownership tops 60%, steady. Retail chases momentum via apps.
Sentiment stays optimistic, blending momentum bias with value checks.
Short-Term Outlook
Technical indicators point to support at $48 holding firm. Market momentum aids if Nasdaq climbs.
Volume trends support mild upside next week. Expect volatility around Fed news.
Medium to Long-Term Outlook
TQQQ ETF’s model shines in bull markets, with Nasdaq growth at 15% annualized. Industry expands via AI.
Competitive edge from tech giants; financial health solid. Risks include recessions.
Long-term investors should hold or accumulate on dips.
FAQ Section
Is TQQQ ETF a buy right now?
Yes for risk-tolerant traders eyeing tech rallies; hold for conservatives.
What is the price target for TQQQ ETF?
Average $65 by end-2026, up to $75 in bull case.
What are major risks for TQQQ ETF?
Leverage decay, tech downturns, high volatility.
TQQQ ETF forecast for 2026?
Bullish if Nasdaq hits 25,000; 20-50% upside possible.
Suggestions
Compare with SOXS ETF analysis
See our QQQ ETF forecast
Read our Nasdaq tech sector breakdown
Conclusion
Hold TQQQ ETF for growth portfolios; watch for breakouts above $52. Bullish tech drivers outweigh risks in stable markets, but leverage suits short holds best.
Disclaimer: This article is for informational purposes only and not financial advice.