
Explore T stock analysis with latest price, earnings, technicals, valuation, and forecast. Is T stock a buy? Get balanced insights for investors on AT&T stock price and trends.
Introduction
AT&T Inc. (T stock) provides wireless, broadband, and digital TV services to millions. Investors watch T stock closely due to its high dividend yield and fiber network growth. Broader market conditions, like steady telecom demand amid economic shifts, impact T stock price.
Latest Stock Price & Trend
T stock closed at $28.00 on February 27, 2026, up 1.97% or $0.54 from the prior day. Over five days, it gained about 2%, showing short-term strength from recent highs near $28. The one-month trend rose roughly 5%, driven by positive earnings reactions.
In three months, T stock climbed around 8%, beating telecom peers amid fiber expansion news. Six-month performance increased by 12%, reflecting steady subscriber gains. Year-to-date through late February 2026, it advanced about 15% from $24 levels earlier in the year.
The 52-week range spans $22.95 low to $29.79 high, with T stock near the top. Overall, the trend looks bullish, indicating investor confidence in AT&T’s cash flow and dividends for steady returns.
Technical Analysis
Support levels sit near $27.50, the recent day low where buyers stepped in. Resistance looms at $29.80, the 52-week high blocking further gains. RSI reading hovers around 60, neutral territory—not overbought above 70 or oversold below 30—signaling balanced momentum.
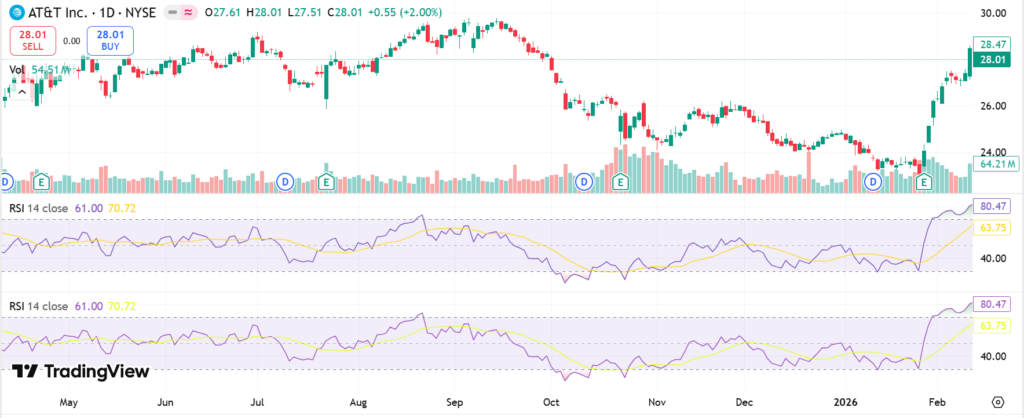
MACD shows a bullish crossover, with the line above signal, hinting at upward price drive. The 50-day moving average at $27.20 supports prices, while the 200-day at $26.00 confirms longer uptrend. No golden cross recently, but 50-day above 200-day points to strength.
Trading volume averaged 41.5 million shares lately, above the day’s 29 million, showing solid interest without spikes. These indicators matter as they help spot entry points and reversal risks for beginners.
Analyst Ratings & Price Targets
Analysts lean mixed on T stock, with holds dominating due to steady but slow growth. Recent actions include Barclays raising target to $24 (buy) and Wells Fargo cutting to $24 (hold). TD Cowen holds at $33.
Average price target sits around $28, with highs at $33 and lows near $24. Wall Street firms like Barclays see value in fiber returns. This sentiment means caution—analysts like reliable dividends over big upside.
Insider Activity
Recent insider moves show gifts, not direct buys or sells, like CEO John Stankey gifting 199,244 shares on February 18. Pascal Desroches gifted 352,000 shares twice around February 25. Lori Lee had in-kind and return transactions worth $2.3 million in late January.
No large buys signal caution; gifts are non-monetary transfers. Jeremy Legg had small exempt moves in November 2025. Trends imply neutral confidence—management holds steady without aggressive buying.
Valuation Analysis
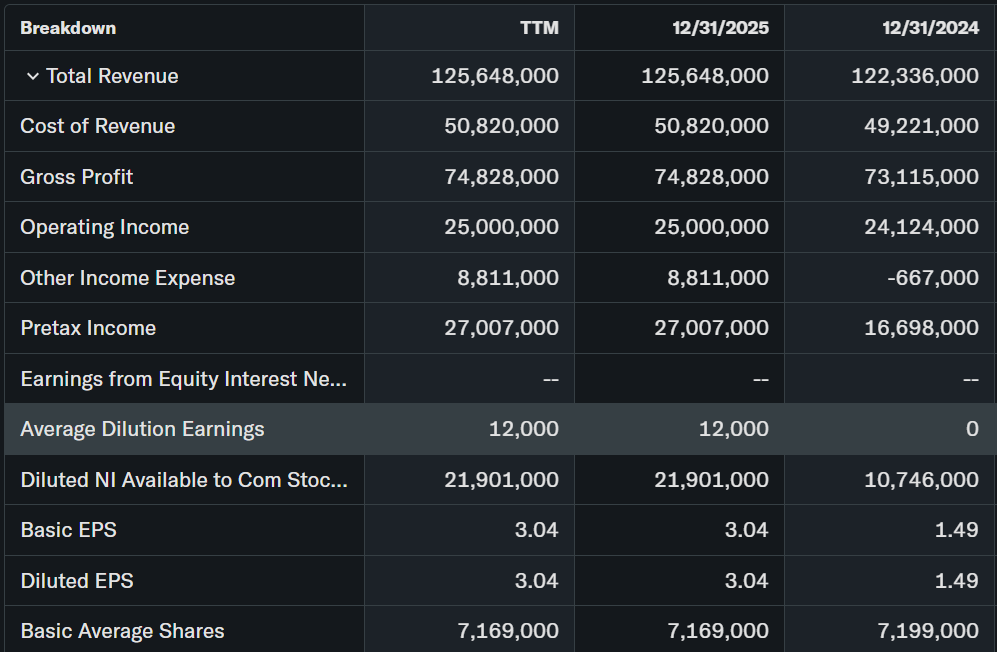
T stock’s trailing P/E is 9.21, forward around 12 based on $2.30 EPS estimates.[finance:estimates] Price-to-sales ratio is 1.57, low for telecoms. Revenue grew 2.7% YoY to $125.6 billion in 2025; EPS rose to $3.04.[finance:income]
Free cash flow hit $19.4 billion (operating cash $40.3B minus $20.8B capex).[finance:cashflow] Cash stands at $18.2 billion with $291.7 billion liabilities, but no total debt listed—net leverage targets 2.5x EBITDA.[finance:balance]
Peers like Verizon (P/E 12.35, P/S higher) and T-Mobile (P/E 22) trade richer; T looks undervalued for dividend seekers.
Recent Earnings & Catalysts
Q4 2025 revenue beat at $33.5 billion vs. $32.9 billion expected; EPS $0.52 topped $0.46. Full-year 2025 EPS $2.12 beat guidance; FCF $16.6 billion at high end. Guidance: 2026 EPS $2.25–$2.35, FCF $18B+.
Catalysts include fiber to 40M locations by 2026 end, Lumen fiber buy, EchoStar spectrum deal. Earnings lifted T stock slightly post-release, rewarding subscriber adds (1.5M postpaid phones).
Bullish Case
Fiber net adds exceed 1M yearly for eight years, with 20%+ revenue growth. Wireless convergence hits 42% in fiber areas, boosting ARPU. Cost savings target $4B by 2028; $45B shareholder returns 2026–2028.
5G and AI fan experiences like Connectopia drive demand. 4% EBITDA growth in 2026 supports 4.04% yield.
Bearish Case
Legacy copper declines drag business wireline 9–11% YoY. Competition from T-Mobile, Verizon pressures margins.[finance:peers] High capex $21–22B strains FCF if subscriber growth slows.
Macro tariffs could raise costs; churn risks in saturated wireless. Regulatory hurdles on deals like Lumen.
Market Sentiment & Investor Psychology
Short interest data limited, but institutional ownership is strong at top holders like Vanguard (664M shares).[finance:institutional] Volume steady, no panic.
Options lean neutral; retail favors dividends over momentum. Sentiment: optimistic on fiber, neutral overall with value bias.
Short-Term Outlook
Technicals show bullish MACD and support hold; volume supports gains. Momentum from earnings lingers, but resistance at $29 caps upside. Expect sideways to mild up if volume stays firm—no big swings likely.
Medium to Long-Term Outlook
Strong business in 5G/fiber; industry grows with broadband demand. Competitive via scale, but peers innovate faster.[finance:peers] Financial health solid with deleveraging to 2.5x.
Hold for dividend collectors; accumulate on dips for growth via $18B+ FCF.
FAQ Section
Is T stock a buy right now?
Hold for yield; buy on weakness if fiber growth continues—undervalued vs. peers.
What is the price target for T stock?
Average $28, high $33, low $24 from analysts.
What are major risks for T stock?
Competition, capex burden, legacy declines.
T stock forecast?
2026 EPS $2.25–$2.35; steady upside from fiber.
T earnings next?
Q1 2026 due soon; watch subscriber adds.
Suggestions
- Compare with Opendoor stock analysis
- See our T-Mobile stock forecast
- Read our telecom sector valuation guide
Final Balanced Conclusion
Hold T stock. Solid dividends and fiber growth offset slow legacy shifts—suits income investors.
Disclaimer: This article is for informational purposes only and not financial advice.