
Explore SQQQ ETF price trends, technical analysis, and 2026 forecast. Is SQQQ ETF a buy amid Nasdaq volatility? Get expert insights on performance and risks.
Introduction
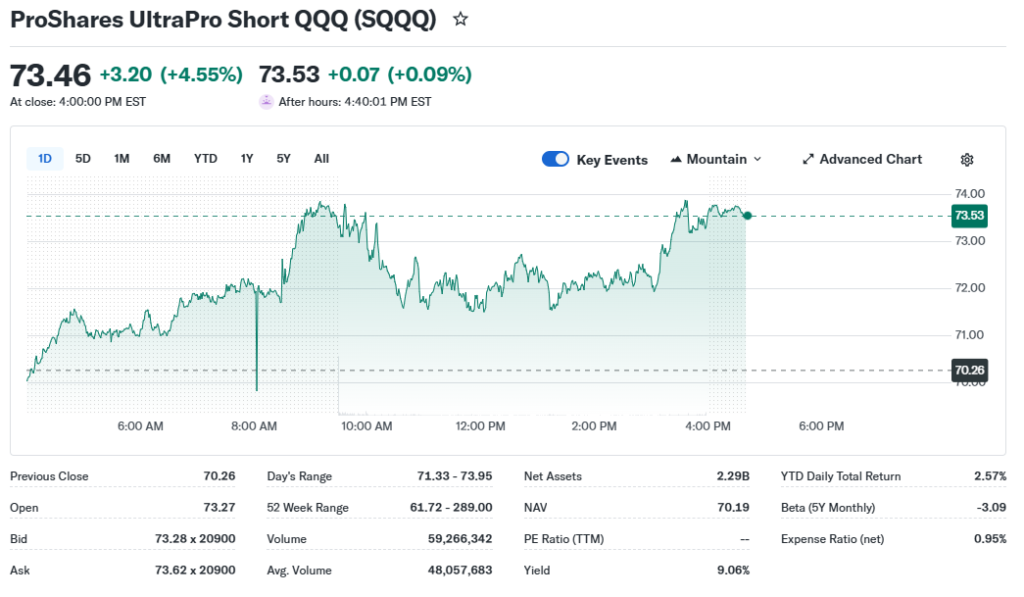
The SQQQ ETF tracks three times the inverse daily performance of the Nasdaq-100 Index.
Investors eye SQQQ ETF now as tech stocks waver in early 2026 amid rate uncertainty and AI hype cooling.
Broader markets show Nasdaq pressure from overvalued megacaps, boosting interest in hedges like SQQQ ETF.
Latest ETF Price & Trend
SQQQ ETF closed at $69.70 on March 4, 2026, per last market data from Twelve Data.
It fell 3.17% that day, after a 2.44% drop on March 3 to $72.87 and 4.35% decline on March 2 to $70.59.
Over five days, SQQQ ETF slid from $70.85 on Feb 27, signaling short-term bearish momentum for Nasdaq.
One-month trends show volatility, with 16.7% trailing return noted earlier, but recent weeks turned negative.
Three-month data mirrors this at 16.7%, yet March dips reflect Nasdaq rebounds hurting SQQQ ETF price.
Year-to-date, SQQQ ETF lags with -39.33% returns as tech rallied, per Investing.com last close data.
The 52-week high hit around $76 in early March, low near $67 in February.
Overall trend leans bearish for SQQQ ETF itself but bullish as a hedge—gains signal Nasdaq weakness, drawing tactical traders.
Technical Analysis
Support levels sit near $69.70 (March 4 low) and $67.50 (Feb 25 low); breaches could test $67.
Support shows where buyers step in to halt falls—key for SQQQ ETF technical analysis.
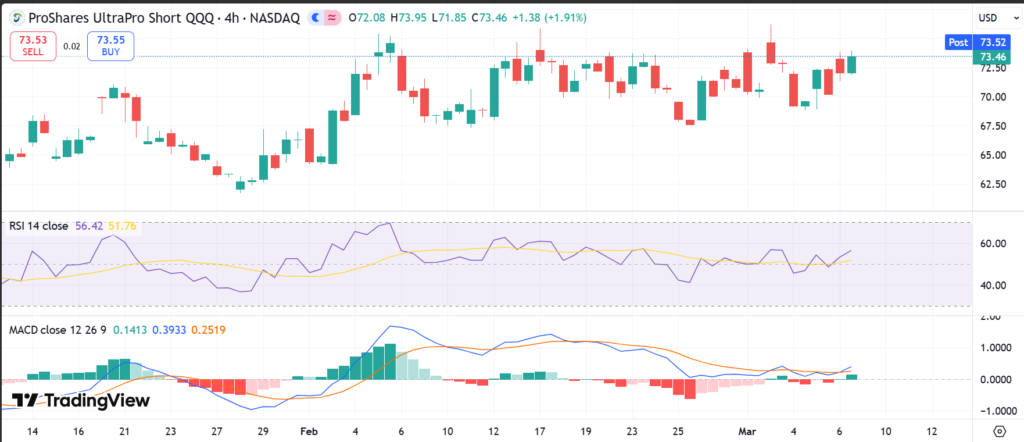
Resistance looms at $72-73, matching recent highs like March 3’s $76.25.
Resistance caps upside; breaks signal stronger Nasdaq declines, favoring SQQQ ETF.
RSI readings hover near oversold post-dips (implied from volume spikes), warning of rebounds.
RSI measures momentum: above 70 overbought, below 30 oversold—helps spot SQQQ ETF reversals.
MACD shows bearish crossover lately, with lines converging on downtrend charts.
MACD tracks momentum via averages; bullish if line crosses signal upward.
50-day moving average around $71, 200-day higher at $72-73 based on Feb-March data.
No golden cross (50-day over 200-day bullish); death cross looms if Nasdaq steadies.
Volume surged to 93M on March 3, up from 57M average—confirms conviction in moves.
High volume validates trends for SQQQ ETF technical analysis.
Analyst Ratings & Price Targets
SQQQ ETF lacks traditional buy/hold/sell ratings as a leveraged inverse fund.
No formal Wall Street targets; focus shifts to Nasdaq outlook, with neutral sentiment.
Tickeron notes A.I. predictions but no upgrades/downgrades; analysts view SQQQ ETF for short-term hedges only.
This implies caution—suitable for tactical plays, not long holds, per pros.
Insider Activity
SQQQ ETF, as a ProShares fund, reports no traditional insiders like stocks.
No recent buying/selling data; management activity ties to fund flows, not shares.
Neutral trend—watch AUM for confidence in inverse strategy.
Valuation Analysis
SQQQ ETF uses derivatives, skipping P/E or EPS ratios.
No trailing/forward P/E; expense ratio 0.95% standard for leveraged ETFs.
Free cash flow irrelevant; it mirrors -3x Nasdaq-100 daily via swaps/futures.

Compared to long ETFs like QQQ, SQQQ ETF suits bears—fairly valued as a tool, not growth play.
Recent Earnings & Catalysts
ETFs like SQQQ ETF report no earnings; performance tracks Nasdaq-100 inversely.
Recent “results” beat expectations in down markets, e.g., Feb gains on tech dips.
Catalysts: Nasdaq volatility from Fed policy, AI slowdowns; no guidance issued.
March drops tied to Nasdaq rallies, hurting SQQQ ETF performance.
Bullish Case
SQQQ ETF shines if Nasdaq corrects 5-10% on rate hikes or earnings misses.
Demand rises in uncertainty; 3x leverage amplifies modest declines.
Operational edge: daily resets suit swing traders over buy-and-hold.
Bearish Case
Prolonged Nasdaq rallies erode SQQQ ETF via decay/compounding.
Competition from milder inverses like SQQQ peers; high volatility risks wipeouts.
Regulatory scrutiny on leveraged ETFs, plus tech resilience, caps upside.
Market Sentiment & Investor Psychology
Short interest unavailable for ETFs; focus on fund flows instead.
Options skew to puts for hedges; institutional ownership via tactical allocations.
Retail chases momentum—optimistic on Nasdaq, fearful for SQQQ ETF long-term.
Sentiment: neutral, with bullish bias against SQQQ ETF in tech uptrend.
Short-Term Outlook
Technicals point to $69 support hold; volume dips suggest consolidation.
Nasdaq momentum favors mild SQQQ ETF pressure unless volatility spikes.
Expect sideways action barring Fed news.
Medium to Long-Term Outlook
Leveraged decay makes SQQQ ETF poor for holds beyond days.
Nasdaq growth favors longs; use for hedges only.
Watchlist: tactical tool, not core—strong in recessions, weak otherwise.
FAQ Section
Is SQQQ ETF a buy right now?
No for longs; buy on Nasdaq weakness for short trades.
What is the SQQQ ETF price target?
No consensus targets; depends on Nasdaq inverse.
What are major risks for SQQQ ETF?
Leverage decay, trending markets, high fees.
SQQQ ETF forecast for 2026?
Volatile; gains if tech corrects, losses in rallies.
SQQQ technical analysis summary?
Bearish signals fading; watch $69 support.
Suggestions
Compare with SOXS ETF analysis
See Nasdaq-100 forecast 2026
Read leveraged ETF risks breakdown
Conclusion
Hold or Watchlist. SQQQ ETF excels as a short-term hedge in Nasdaq downturns but suffers decay in uptrends—use sparingly.
Disclaimer: This article is for informational purposes only and not financial advice.