
Explore SOXS ETF price, technical analysis, forecast, and if SOXS ETF is a buy amid semiconductor volatility. Get latest trends and outlook for Direxion Daily Semiconductor Bear 3X Shares
Introduction
SOXS ETF seeks daily investment results equal to 300% of the inverse of the ICE Semiconductor Index performance.
Investors watch SOXS ETF now as AI-driven semiconductor stocks rally hard, boosting inverse plays like this one.
Broader market conditions favor tech bulls, with Nasdaq highs pressuring leveraged bear ETFs like SOXS ETF.
Latest ETF Price & Trend
At last market close on March 4, 2026, SOXS ETF traded around $3.41, down sharply year-to-date by about 34%.
One-day performance showed volatility typical for 3x leverage, while 5-day and 1-month trends fell 36% as semis surged.
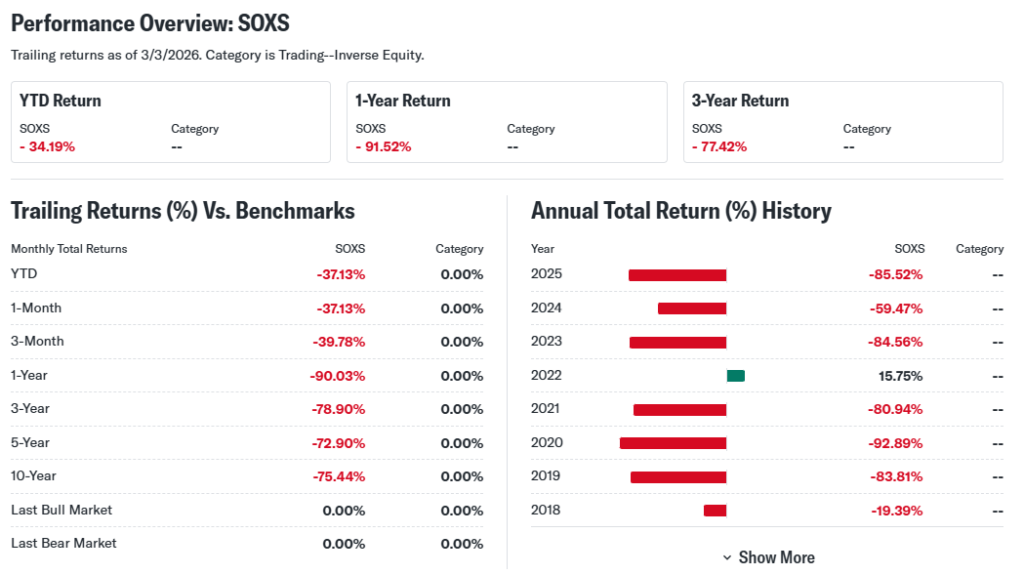
Over 3 months, SOXS ETF lost 52%; 6 months saw deeper declines amid sector boom, with year-to-date at -34% and yearly -82%.
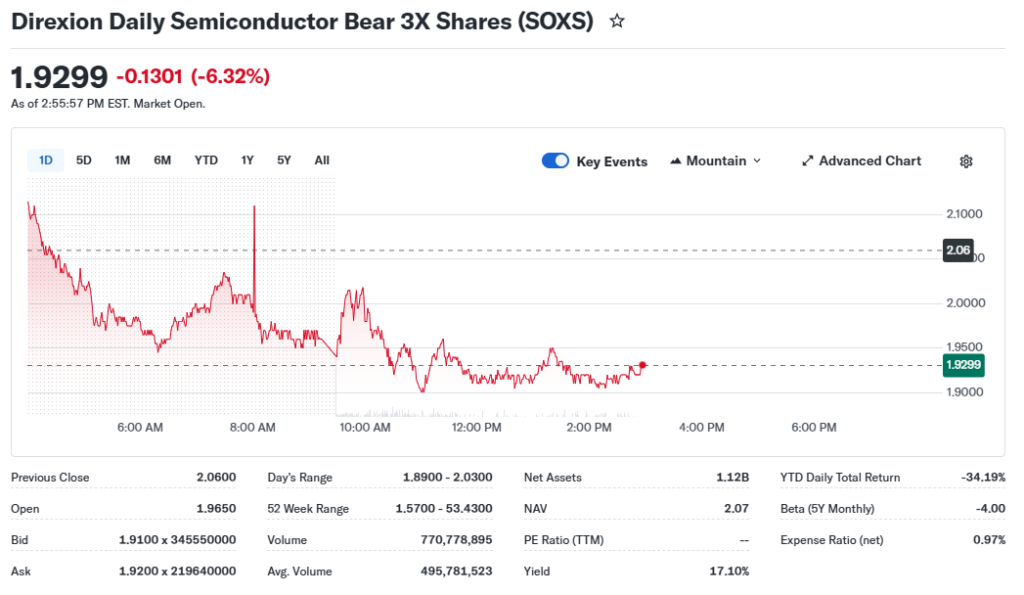
52-week high hit $53.43 last April, low near $1.57 recently; overall trend is bearish for SOXS but indicates strong semis momentum.
This suggests investors betting against chips face compounding losses in uptrends.
Technical Analysis
Support levels sit at $1.51 and $1.26; these act as price floors where buyers may step in during pullbacks.
Resistance at $2.06 challenges upside; breaking it signals potential bull continuation for this bear ETF.
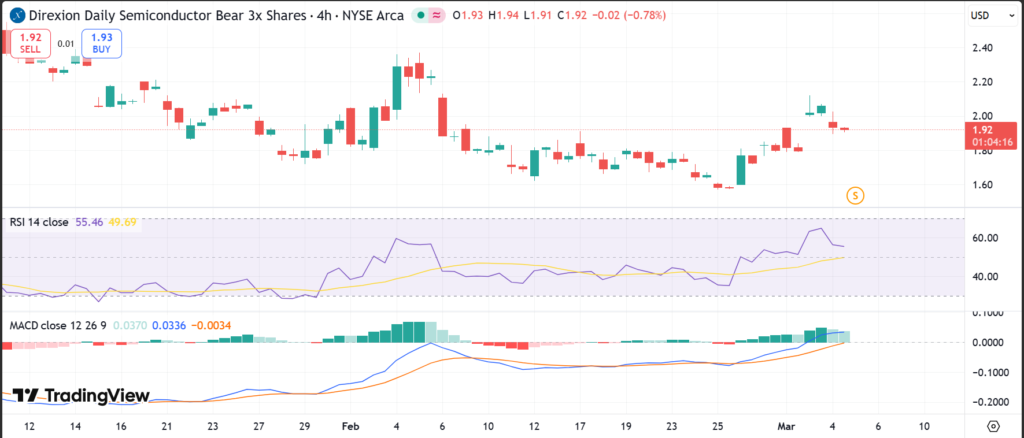
RSI at 55.47 shows neutral momentum, neither overbought above 70 nor oversold below 30, helping spot reversal risks.
MACD at -0.1 with histogram positive hints at sell bias easing, a trend-following tool for momentum shifts.
50-day moving average around $1.73 and 200-day at $5.43 place price below both, signaling downtrend; no golden cross (bullish 50 over 200) or death cross seen lately.
Trading volume trends align with volatility, key for confirming moves in leveraged funds like SOXS ETF.
Analyst Ratings & Price Targets
Leveraged inverse ETFs like SOXS ETF rarely get traditional Buy/Hold/Sell ratings due to daily reset risks.
No specific Wall Street targets from major firms; focus stays on underlying semis like NVDA with bullish calls.
Recent sentiment leans neutral to sell for SOXS ETF, as analysts favor long semi exposure over shorts.
This implies caution for investors using SOXS ETF as a hedge, not long-term hold.
Insider Activity
Direxion manages SOXS ETF passively; no traditional insider buying/selling applies as with stocks.
Fund flows reached $1.76B inflows over 1 year, showing bearish bets amid semi hype.
No large transactions or management share trends; activity reflects trader positioning, not insider confidence.
This suggests speculative caution rather than deep conviction.
Valuation Analysis
SOXS ETF lacks P/E or EPS as a leveraged derivative; valuation ties to NAV at $3.41, trading near par.
No revenue growth or free cash flow metrics; expense ratio 0.97% erodes returns over time.
Debt/cash irrelevant; compares poorly to long semi ETFs like SOXX up 33% yearly.
SOXS ETF appears fairly valued for short-term tactics but over-erodes in bull markets.
Recent Earnings & Catalysts
ETFs like SOXS ETF report no quarterly earnings; performance tracks inverse semi index daily.
No EPS/revenue beats; recent catalyst is semi rally from AI demand, crushing SOXS ETF by 87% YTD in peaks.
Forward guidance absent; high dividend yield 17.62% from rebalancing, not earnings.
This drove sharp SOXS ETF price drops post-rallies.
Bullish Case
SOXS ETF gains if semis correct on overvaluation or AI slowdown.
Market demand pullback could boost inverse returns short-term.
Leverage amplifies dips; operational resets aid in volatility spikes.
Bearish Case
Semiconductor boom from AI persists, compounding SOXS ETF losses daily.
Competition from bull ETFs like SOXX draws flows away.
Margin decay in trends, regulatory caps on leverage, economic strength hit shorts.
Market Sentiment & Investor Psychology
Short interest unavailable for ETFs; options show put/call skew favoring semis longs.
Institutional ownership steady at $1.12B AUM; retail piles into bull trades.
Momentum biases long semis, value in bears overlooked.
Sentiment neutral to optimistic for semis, fearful for SOXS ETF holders.
Short-Term Outlook
Technical indicators like neutral RSI and MACD sell signal point to choppy action.
Market momentum in semis and volume suggest more pressure on SOXS ETF.
Expect volatility without clear semi pullback.
Medium to Long-Term Outlook
Daily reset weakens SOXS ETF for holds beyond trades.
Industry growth in semis favors longs; competitive moat thin for bears.
Financial health solid but erosion risks high; watch for tactical shorts.
Long-term investors should avoid or use sparingly as hedges.
FAQ Section
Is SOXS ETF a buy right now?
No strong buy case; suits short hedges in semi downturns only.
What is the price target for SOXS ETF?
No consensus targets; tied to semi declines, volatile forecast.
What are major risks for SOXS ETF?
Compounding losses, expense drag, bull semi trends.
SOXS ETF forecast for 2026?
Bearish bias if semis rally continues; neutral RSI hints stalls.
SOXS technical analysis summary?
Below MAs, neutral momentum; watch support at $1.51.
Suggestions
Compare with GDXD ETF analysis
See our NVDA semiconductor forecast
Read our tech sector bear ETF breakdown
Conclusion
Watchlist. SOXS ETF fits tactical traders eyeing semi weakness, but leverage risks dominate in bull markets. Hold off for longs.
Disclaimer: This article is for informational purposes only and not financial advice.