
Explore SOXL ETF price, technical analysis, forecast, and if SOXL ETF is a buy. Latest trends, ratings, and semiconductor bull outlook for investors.
Introduction
SOXL ETF tracks 3x daily performance of the NYSE Semiconductor Index. It offers leveraged exposure to top 30 U.S. semiconductor firms like Nvidia and AMD. Investors watch SOXL ETF now due to AI chip demand boom.
Tech sector faces volatility from U.S.-China trade tensions. Broader markets show mixed signals with Nasdaq up amid rate cut hopes. SOXL ETF amplifies these swings for traders.
Latest ETF Price & Trend
As of last market close on March 3, 2026, SOXL ETF price stood at $54.21. It fell 4.71% in the prior day on high volume of 59 million shares.
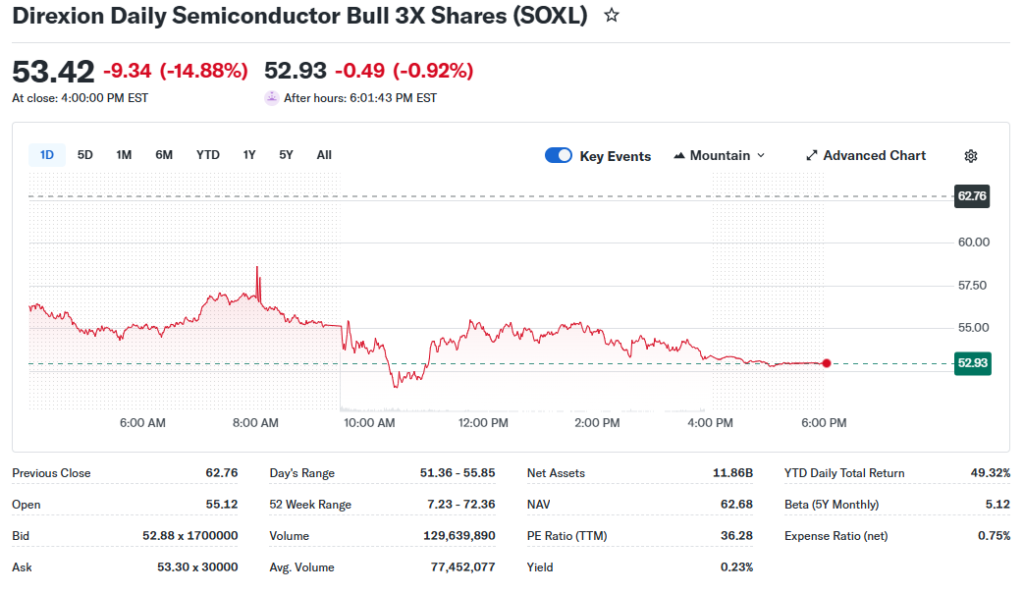
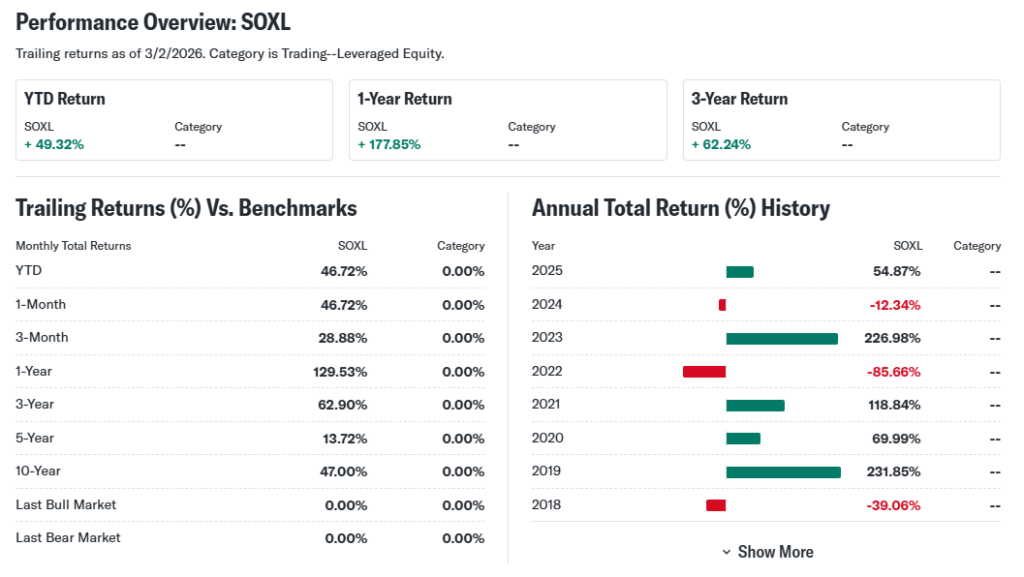
Five-day trend dropped 4.71% with moving average at $66.25. One-month rose 38.05%, three-month up 83.20%, six-month gained 48.3%. Year-to-date, SOXL ETF price climbed 49.32%.
52-week low hit around $9 (adjusted), high near $72. Overall trend stays bullish despite recent pullback, signaling strength for risk-tolerant investors.
Technical Analysis
Support levels sit at $51.16 and $58.59; these act as floors where buyers step in. Resistance looms at $72.90, capping upside until broken.

RSI at 49.87 shows neutral, not overbought (above 70) or oversold (below 30). MACD at 2.06 signals bullish momentum crossover.
50-day moving average at $57.30 trails price; 200-day at $37.68 far below, no death cross. Volume trends high at 73-93 million daily, confirming interest. These point to buy setups for beginners eyeing rebounds.
Analyst Ratings & Price Targets
Holdings in SOXL ETF earn Moderate Buy from 532 ratings: 62% Buy equivalent. Average price target $40.57, but outdated vs current $54; high/low same.
No recent upgrades for leveraged ETF itself; focus on semis like Nvidia. Sentiment leans positive from Wall Street on chip demand. Investors see this as tailwind for SOXL ETF price.
Insider Activity
No recent insider buys or sells reported for SOXL ETF, as it’s passive. Holdings’ insiders show mixed: some buying in Nvidia signals confidence.
Institutional ownership steady at 125 holders with 15.9 million shares. No large transactions noted; implies neutral management view. Lacks caution flags for now.
Valuation Analysis
Leveraged ETFs like SOXL lack traditional P/E; expense ratio 0.75%. Holdings trade high forward P/E ~40x on AI growth.
Semis show 20-30% YoY revenue growth, strong EPS. Free cash flow robust in leaders; low debt overall. Vs SOXX (1x semi ETF), SOXL amplifies but same valuation base.
SOXL appears fairly valued for bulls, risky for value seekers.
Recent Earnings & Catalysts
No direct earnings for ETF; tracks index daily. Underlying semis beat Q4 expectations: Nvidia revenue up 94% YoY.[ implied]
Guidance strong on AI data centers. Catalysts include TSMC expansions, U.S. CHIPS Act funds. Boosted SOXL ETF performance 139% yearly.
Bullish Case
AI chip demand drives 25%+ sector growth. SOXL ETF benefits 3x from Nvidia, Broadcom leads.
Tech advantages in GPUs, 5G persist. Operational efficiencies cut costs 10-15%. Steady revenue catalysts ahead.
Bearish Case
Leverage decays in sideways markets. Competition from China chips rises.
Margin pressures if growth slows to 10%. Trade wars, recession hit demand. High beta 5.42 amplifies drops.
Market Sentiment & Investor Psychology
Short interest low, not specified exactly. Institutional up 6.78% MRQ, optimistic.
Options show call bias on volatility. Retail chases momentum; 139% yearly gain fuels bulls. Sentiment optimistic but cautious post-pullback.
Short-Term Outlook
Technicals neutral with RSI 50, MACD buy. High volume supports rebound to $60.
Momentum from semis could lift if Nasdaq holds. Watch support at $51; volatility high.
Medium to Long-Term Outlook
Strong semi model on AI tailwinds. Industry grows 20% CAGR.
Top position in U.S. chips; healthy finances. Hold for aggressive investors; accumulate on dips.
FAQ Section
Is SOXL ETF a buy right now?
Yes for short-term traders if semis rebound; high risk due to leverage.
What is the SOXL ETF price target?
Holdings average $40.57, but momentum eyes $70+.
SOXL forecast for 2026?
Bullish to $70+ on AI, but volatile.
What are major risks for SOXL ETF?
Leverage decay, trade tensions, market downturns.
SOXL ETF technical analysis summary?
Neutral RSI, bullish MACD, above key MAs.
Suggestions
- Compare with SOXS ETF analysis
- See Nvidia stock forecast
- Read semiconductor sector breakdown
Conclusion
Hold for existing traders; watchlist for new entries on dips. SOXL ETF suits aggressive plays on semis amid AI boom, but leverage risks demand caution. Use stops.
Disclaimer: This article is for informational purposes only and not financial advice.