
SIDU stock forecast examines $1.92 price, 127M market cap, -78% YTD decline, and speculative space sector positioning. Is SIDU stock a buy amid March 2026 swings?
Introduction
Sidus Space (SIDU stock) develops satellites and space hardware for commercial and government missions. It focuses on low-earth orbit solutions, satellite manufacturing, and space domain awareness technologies.
Investors monitor SIDU stock closely after extreme 2026 volatility from $1.04 lows to $2.08 highs. Microcap space stocks swing wildly amid defense budget debates and commercial satellite demand uncertainty.
Latest Stock Price & Trend
SIDU stock traded at $1.92 on March 8, 2026 (latest data), up 3.7% from $1.85 intraday low with $127.05M market cap. March 6 close registered $2.00 on 2.27M shares volume.
Five-day action volatile: March 2 $2.03 open tested $1.80 lows before recovery. One-month decline 6.31% from late February peaks around $2.05.
Three-month performance reflects multi-month downtrend continuation; six-month YTD -78.78% catastrophic drawdown from 2025 highs.
52-week range spans sub-$1.00 distressed levels to $5+ speculative peaks. Overall trend bearish with brief dead-cat bounces – investors face extreme risk profile.
Technical Analysis
Support critical at $1.80-$1.85 matching March intraday lows where buyers emerged. Support identifies demand zones during declines.
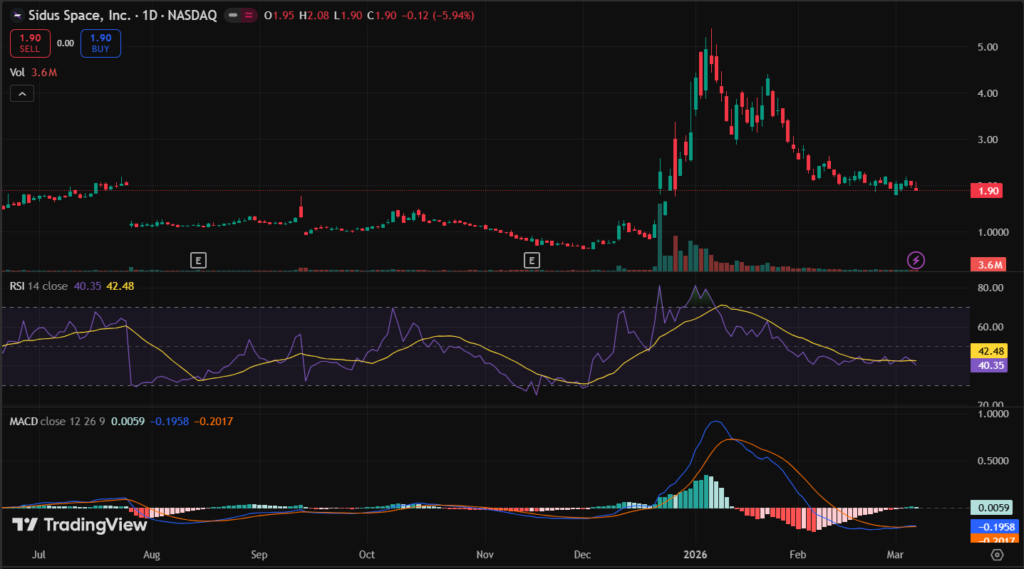
Resistance targets $2.08 recent highs and $2.20 prior consolidation overhead. Breaking $2.20 confirms short-term momentum.
RSI oversold territory after 78% YTD decline signals potential technical bounce. RSI measures momentum extremes for timing trades.
MACD bearish but flattening suggesting exhaustion. MACD tracks trend acceleration changes.
Microcap volume spikes 2-4M shares validate institutional tests; steady 1M+ flow confirms speculative interest.
Analyst Ratings & Price Targets
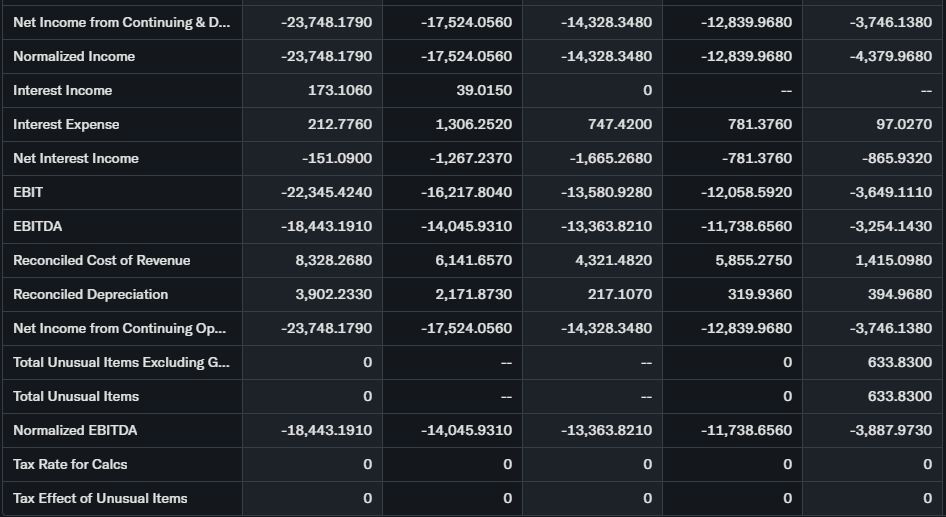
No active Wall Street coverage typical for $127M microcaps trading sub-$2. P/E ratio -1.48 reflects ongoing losses pre-profitability.
Speculative traders rely on technical patterns and contract news over traditional ratings. Lack of coverage signals high execution risk for investors.
Insider Activity
No recent Form 4 transactions highlighted across sources. Management focused on satellite delivery milestones versus personal trading.
66M shares outstanding stable float post-dilution cycles. Steady activity prioritizes operational execution over confidence signals.
Valuation Analysis
Trailing P/E -1.48 confirms loss-making status typical pre-revenue space firms. Forward P/E N/A pending contract execution.
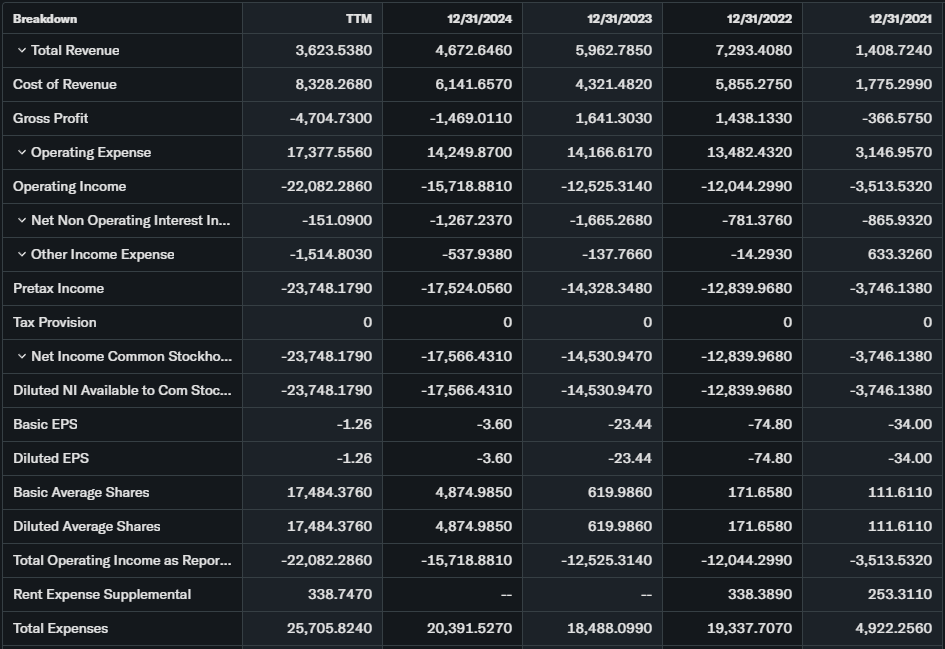
$127M market cap / microcap revenue creates extreme sales multiple reflecting speculative premium. Free cash flow negative during development phase.
Debt/cash undisclosed; government contracts typically provide milestone payments. Versus established space peers, SIDU trades speculative distress discount with binary execution outcome.
Recent Earnings & Catalysts
Earnings timing tracks quarterly satellite milestones vs. traditional calendars. Recent price action suggests contract anticipation driving March swings.
Key catalysts: DoD satellite awards, LizzieSat constellation progress, space domain awareness contracts. NASA commercial crew opportunities create pipeline visibility.
2.27M volume spikes align with contract rumor cycles typical microcap space names.
Bullish Case
DoD budget tailwinds favor domestic satellite manufacturers. LizzieSat constellation creates recurring service revenue potential.
$1.92 entry represents multi-fold upside to $5+ prior peaks if contracts materialize. Microcap asymmetry rewards flawless execution.
Bearish Case
78% YTD destruction reflects execution failures. Ongoing losses P/E -1.48 burn cash without revenue inflection.
Dilution history erodes shareholders during capital raises. SpaceX dominance crushes commercial viability for tier-2 players.
Market Sentiment & Investor Psychology
March 2026 $1.00 calls trade $1.04 bid showing speculative lottery bets. $8.00 calls $0.05 reflect moonshot positioning.
Retail momentum chasing 2M+ volume spikes; institutions avoid sub-$2 microcaps. Sentiment speculative: lottery ticket mentality dominates.
Short-Term Outlook
$1.80 support test critical with 2M+ volume confirming $2.20 resistance breaks. 10-20% daily swings guaranteed microcap behavior.
$1.75-$2.25 range likely absent contract headlines. DoD budget news drives binary catalysts.
Medium to Long-Term Outlook
Satellite manufacturing niche offers defense exposure without prime contractor premiums. Financial survival hinges on cash preservation through 2026.
Execution binary: contract wins create multi-baggers; misses guarantee delisting risk. Long-term investors: avoid entirely, speculative traders size tiny.
FAQ
Is SIDU stock a buy right now?
Speculative lottery position only; high probability of total loss.
What is the price target for SIDU stock?
No analyst coverage; $5+ prior peaks possible on contracts.
What are major risks for SIDU stock?
Dilution, execution failure, cash burn, SpaceX competition, delisting.
SIDU YTD performance?
-78.78% catastrophic decline from 2025 highs.
SIDU business focus?
Satellite manufacturing, space domain awareness, DoD contracts.
Suggestions
Compare with Opendoor
See our Microsoft stock forecast for Azure satellite synergies.
Read our microcap space sector risk analysis.
Conclusion
Watchlist – speculative positions only. SIDU stock offers binary lottery upside at $1.92 with 127M cap, but -78% YTD, -1.48 P/E, dilution history screams extreme caution. DoD contracts make-or-break survival. Size tiny or avoid completely.
Disclaimer: This article is for informational purposes only and not financial advice.