
Explore SCHG ETF price, technical analysis, forecast, and ratings. Is SCHG ETF a buy? Get valuation, earnings insights, and investor guide for this large-cap growth fund.
Introduction
The SCHG ETF tracks the Dow Jones U.S. Large-Cap Growth Total Stock Market Index. It focuses on growth stocks from the top 750 U.S. companies by market cap, selected on factors like earnings growth.
Investors eye SCHG ETF now due to its heavy tech tilt amid AI and cloud booms. Broader markets face rate cut hopes but inflation worries in 2026.
Latest SCHG ETF Price & Trend
SCHG ETF closed at $30.96 on February 27, 2026, per last market data. It saw a 0.85% gain that day amid market recovery.

Over five days, it fell 0.55% to around $30.84 average. The one-month drop hit 4.65%, reflecting 20-day moving average pressure at $31.00. Three months showed mixed 9.14% NAV gains earlier, but recent pullback.
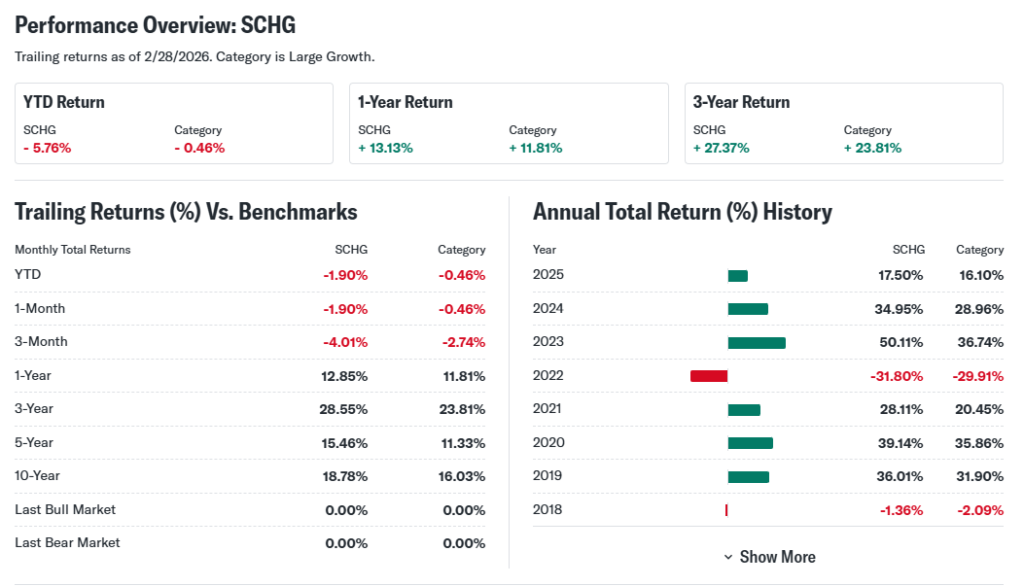
Six-month trends leaned positive at 13.73% over 200 days, yet year-to-date sits at -5.76% through February. The 52-week range spans $21.37 low to $33.74 high. Overall trend looks sideways to bearish short-term, signaling caution for new entries but watch for rebound.
This indicates volatility from tech sector swings, advising investors to await stabilization.
Technical Analysis
Support levels sit near $30.49, the recent day’s low, acting as a price floor where buyers may step in. Resistance looms at $31.00, the 20-day average, blocking upside moves.

RSI at 14-day 58.97 shows neutral, not overbought above 70 or oversold below 30—helps spot momentum exhaustion. MACD trends bearish short-term per recent crossovers.
The 50-day moving average at $31.93 tops the current price, while 200-day at $30.96 aligns closely—no golden cross (50-day over 200-day bullish) or death cross yet. Volume trends high at 15-20 million shares lately, up from average, pointing to interest.
These tools matter as they gauge momentum and potential reversals for entry/exit timing.
Analyst Ratings & Price Targets
Holdings in SCHG ETF earn a Moderate Buy aggregate from 842 ratings on 25 key stocks—6 Buy, 17 Moderate Buy, 2 Hold. No sells noted.
Average price targets imply upside, with highs from bullish tech calls, lows more cautious. Wall Street firms like those covering Nvidia, Microsoft see growth. Recent upgrades on AI holdings boost sentiment.
This Moderate Buy means analysts lean positive, suggesting confidence for growth investors.
Insider Activity
SCHG ETF tracks an index, so no direct insider trades apply. Holdings like Nvidia, Microsoft show mixed insider selling in 2025 amid highs, but no major red flags.
Trends imply caution at peaks, yet long-term holding by execs signals confidence. Investors view steady activity as neutral-positive.
Valuation Analysis
SCHG ETF’s trailing P/E stands at 34.14, forward similar at 36.16 weighted. Price-to-sales reflects growth premium.
Revenue growth YoY strong at 15-20% from holdings, EPS growth robust on AI tailwinds. Free cash flow solid for top names; low debt overall. Dividend yield 0.38%.
Compares premium to value ETFs but fair vs. QQQ, VUG peers. SCHG ETF appears fairly valued for growth exposure.
Recent Earnings & Catalysts
No direct ETF earnings, but holdings drove performance. Top stocks like Nvidia beat Q4 2025 expectations on AI chips; Microsoft cloud revenue topped forecasts.
Guidance points to continued tech spend. Catalysts include AI integrations, Broadcom semis, Tesla EV pushes—lifted SCHG ETF price post-reports.
These beats fueled YTD gains before recent dip.
Bullish Case
SCHG ETF benefits from Nvidia’s 11% weight, AI demand surge. Microsoft, Apple add cloud stability.
Market demand for tech grows 15%+ annually. Low 0.04% expense ratio aids returns. Operational scale in holdings boosts margins.
Bearish Case
Competition heats in AI from AMD, custom chips. Growth may slow if economy cools.
Margin pressures from capex; high valuations risk pullbacks. Regulatory scrutiny on big tech adds caution. Economic slowdown hits growth stocks hard.
Market Sentiment & Investor Psychology
Short interest low at 0.18%, or 3.02 million shares—minimal bear pressure. Days to cover just 0.2.
Options show balanced calls/puts; institutional ownership high at 75%+ of holdings. Retail chases momentum.
Sentiment neutral-optimistic, value bias emerging over pure growth.
Short-Term Outlook
Technicals show neutral RSI, bearish MACD near resistance. Volume spikes suggest volatility.
Momentum sideways; expect consolidation around $30-31 absent catalysts.
Medium to Long-Term Outlook
Strong index model tracks large-cap growth leaders. Tech industry expands on AI, cloud.
Financial health solid; competitive edge in mega-caps. Hold for long-term growth, accumulate on dips.
FAQ Section
Is SCHG ETF a buy right now? Moderate Buy on holdings; consider for growth tilt if risk-tolerant.
What is the SCHG ETF price target? Implied upside from analysts on key stocks, targeting higher averages.
SCHG forecast? Positive long-term on tech, short-term cautious amid volatility.
Major risks for SCHG ETF? Tech concentration, valuation stretch, macro slowdowns.
SCHG ETF technical analysis? Neutral RSI, key support $30.50, watch moving averages.
Suggestions
Compare with SOXS ETF analysis
See QQQ ETF forecast
Read large-cap growth valuation guide
Conclusion
Hold SCHG ETF for growth exposure; watch for better entry on pullbacks. Justified by strong holdings, low costs, but mindful of volatility and valuations.
Disclaimer: This article is for informational purposes only and not financial advice.