
Invesco QQQ Trust Overview
The Invesco QQQ Trust (QQQ) is a popular ETF that tracks the Nasdaq-100 Index, focusing on the 100 largest non-financial companies listed on the Nasdaq. Heavily weighted toward technology giants like Apple, Microsoft, and Nvidia, it offers traders exposure to innovative sectors driving market growth.
Traders watch QQQ closely in March 2026 amid ongoing AI advancements and economic shifts under the current administration. This article breaks down the short-term trend, key support and resistance levels, RSI, MACD, and volume signals, plus a forward outlook for retail traders.
Current Price Trend in March 2026
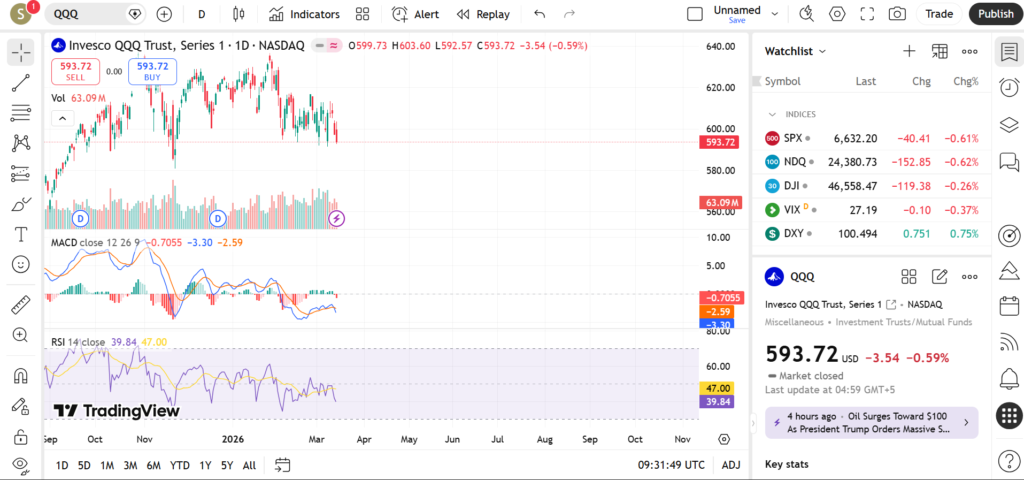
QQQ has shown resilience in early March 2026, maintaining an overall uptrend after a volatile start to the year. Recent price action features higher lows from February swings, with the ETF holding above its 20-day and 50-day moving averages, signaling short-term bullish momentum.
The 200-day moving average acts as dynamic support further below, while major swings from late 2025 highs remain untested. This setup suggests buyers are in control during pullbacks, though range-bound trading could emerge if volume doesn’t confirm breakouts. Educational note: Moving averages help smooth price data to spot trends—watch if price stays above the 50-day for continuation.
Key Support and Resistance Levels
Support levels provide potential buying zones where price might bounce, often at prior lows or moving averages.
- Around the recent swing low near February 2026 lows—traders may watch this as initial support from high-volume tests.
- Near the 50-day moving average—a key dynamic level where pullbacks have stabilized historically.
- Previous gap fill from early 2026—a technical magnet drawing price during consolidations.
- 200-day moving average—major long-term support that could signal deeper correction if breached.
Resistance levels cap upside until broken, often at prior highs or round numbers.
- Near the 20-day moving average on minor rallies—short-term hurdle for momentum.
- Recent swing high from mid-February—a psychological barrier with selling pressure.
- All-time high zone or 52-week peak—tests here could confirm uptrend strength.
- Round number above recent highs—attractive for profit-taking by shorts.
A break above upper resistances might indicate renewed bullish momentum toward new highs, encouraging traders to eye long setups. Conversely, a close below key supports could signal weakness, prompting caution or short opportunities.
Indicators – RSI, MACD, Volume
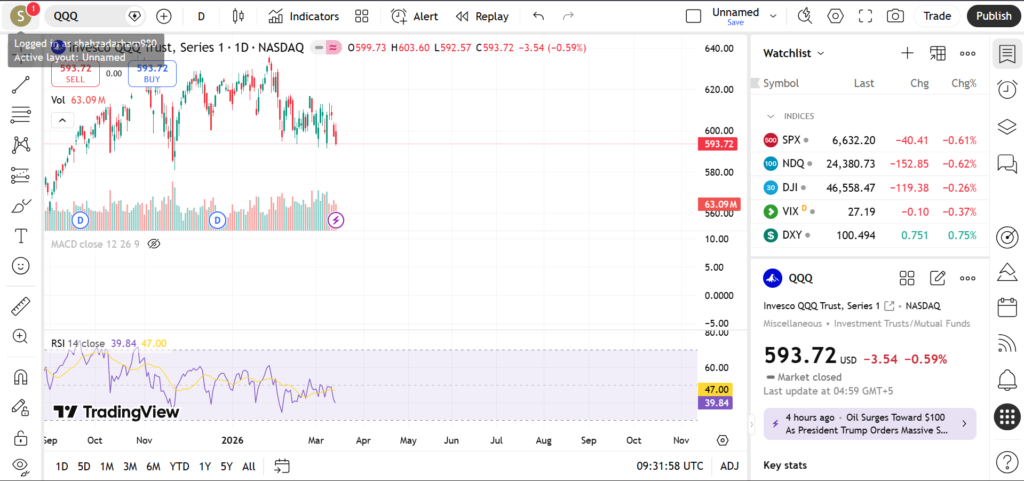
RSI (Relative Strength Index) measures momentum on a 0-100 scale, highlighting overbought (above 70) or oversold (below 30) conditions. In March 2026, QQQ’s RSI hovers in neutral territory around 55-60, avoiding extremes and suggesting room for upside without immediate reversal risk.
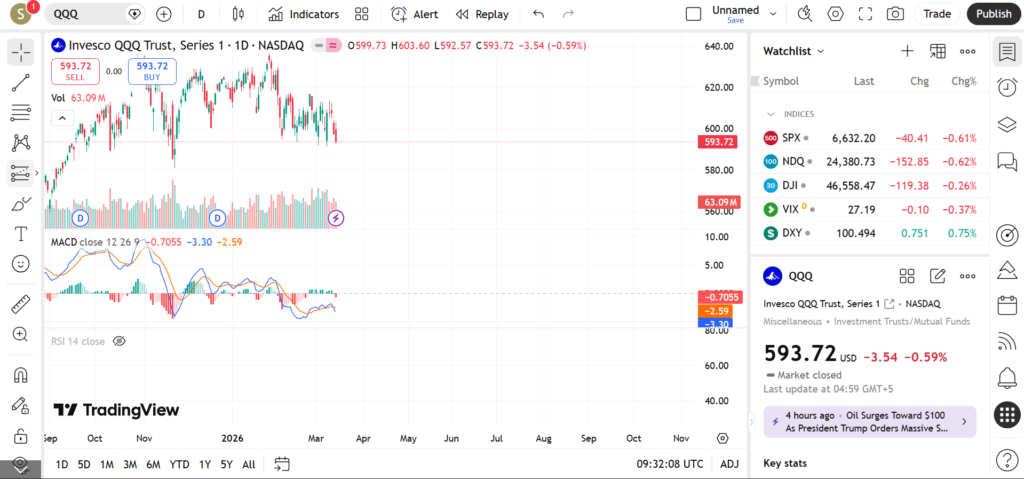
MACD (Moving Average Convergence Divergence) tracks momentum via line crossovers and histogram. The MACD line remains above the signal line in a bullish setup, with histogram bars expanding—indicating momentum buildup, though watch for divergence if price stalls.
Volume behavior shows spikes on recent up days, supporting rallies, while pullbacks occur on lighter volume— a healthy sign for bulls. Declining volume on dips reinforces accumulation, but traders should monitor for spikes on breakdowns as potential distribution clues.
Short-Term Outlook for QQQ in March 2026
The technical picture for QQQ in March 2026 leans bullish, with price respecting key moving averages and indicators flashing positive signals amid tech sector strength. Neutral RSI and supportive volume provide a balanced setup for potential continuation higher, barring macro disruptions.
- Traders are watching a break above recent swing highs for confirmation of uptrend acceleration.
- Key support at the 50-day MA—holding here could spark another leg up.
- Upcoming Fed comments or tech earnings as catalysts for volatility.
- Nasdaq sector rotation, especially AI and semiconductors influencing QQQ.
- Broader market indices like S&P 500 for correlation cues.
Risks and Important Notes
Technical levels can fail unexpectedly due to news like interest rate surprises, geopolitical tensions, or sector-specific earnings misses. Always use stop-losses and position sizing to manage risk, as past patterns don’t predict future moves.
This analysis is educational and based on standard technical tools—not personalized advice. Retail traders should combine it with their risk tolerance and fundamental research.
For more insights, check our technical analysis on SPY (S&P 500 ETF) or IWM (Russell 2000 ETF). Stay updated on Nasdaq trends and trade smart!