
Direxion Daily PLTR Bear 1X ETF Overview
The Direxion Daily PLTR Bear 1X ETF (PLTD) seeks to deliver the inverse (-1x) of the daily performance of Palantir Technologies (PLTR) stock, before fees and expenses. Launched in late 2024, it targets traders looking to profit from or hedge against declines in PLTR, a high-volatility AI and data analytics leader, making it a niche tool in the single-stock ETF space.
In March 2026, PLTD draws attention amid PLTR’s post-earnings volatility and AI sector rotations, with the bear ETF experiencing sharp swings tied to its underlying. This detailed analysis explores the short-term price trend, essential support and resistance levels, RSI/MACD signals, volume dynamics, and a pragmatic outlook to help retail traders navigate this leveraged instrument educationally.
Current Price Trend in March 2026
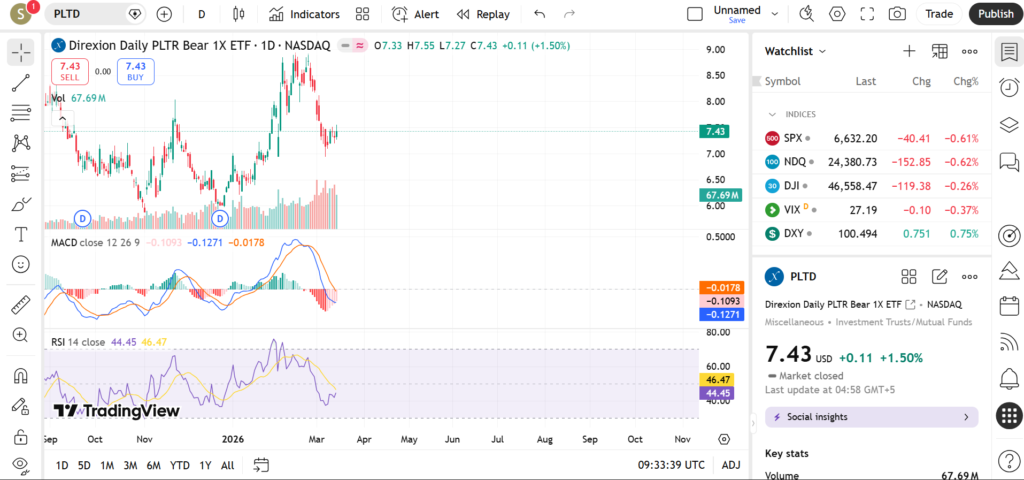
PLTD has entered a pronounced downtrend in early March 2026, trading well below its key moving averages after peaking earlier in the year when PLTR rallied. The ETF lurks around recent lows near $7.32-$7.52, under the 5-day MA at $7.70, 20-day at $8.21, and 50-day at $9.07, confirming short-term bearish dominance with no 200-day MA available due to its youth.
Recent price action reveals lower highs and accelerating declines, with a 12.45% drop over five days and 21% over 20 days, reflecting PLTR’s strength pressuring the inverse ETF. Major swings align with PLTR news cycles, teaching traders about daily reset mechanics in inverse products—prolonged holds amplify decay, so watch for MA fans sloping downward as confirmation of weakness, potentially range-bound if PLTR stabilizes.
This setup highlights leveraged ETF risks: while short-term trades capture inverse moves, multi-day trends erode value through compounding, urging focus on intraday or swing plays around PLTR catalysts.
Key Support and Resistance Levels
Support levels mark potential stabilization zones for PLTD, often at prior lows or psychological points, though inverse nature ties them to PLTR rallies.
- Near recent session lows around $7.24-$7.32—high-volume tests from March 11-13, acting as immediate floor with oversold exhaustion potential.
- Around the 52-week low extensions or round number at $7.00—a psychological magnet and gap fill from inception volatility.
- Prior consolidation from February lows—a volume cluster where buyers defended during PLTR pauses.
- Deeper prior lows near $6.00 levels—ultimate support if PLTR surges continue, signaling extreme bearish positioning for PLTD.
Resistance levels challenge any bounce attempts, coinciding with moving averages and faded highs.
- Close to the 5-day and 20-day MAs ($7.70-$8.21)—short-term hurdles where sellers likely re-emerge on PLTR gains.
- Mid-March swing highs around $7.55—recent rejection zone with profit-taking history.
- 50-day MA at $9.07—significant barrier requiring PLTR weakness to approach.
- Year-to-date intermediate highs near $14—ambitious overhead from early 2026 peaks, unlikely without major PLTR reversal.
A break above key resistances might signal short-term relief for PLTD (PLTR downside), encouraging traders to eye bounces with tight stops; conversely, breaches below supports could accelerate declines, highlighting opportunities for short strategies if volume confirms.
Indicators – RSI, MACD, Volume
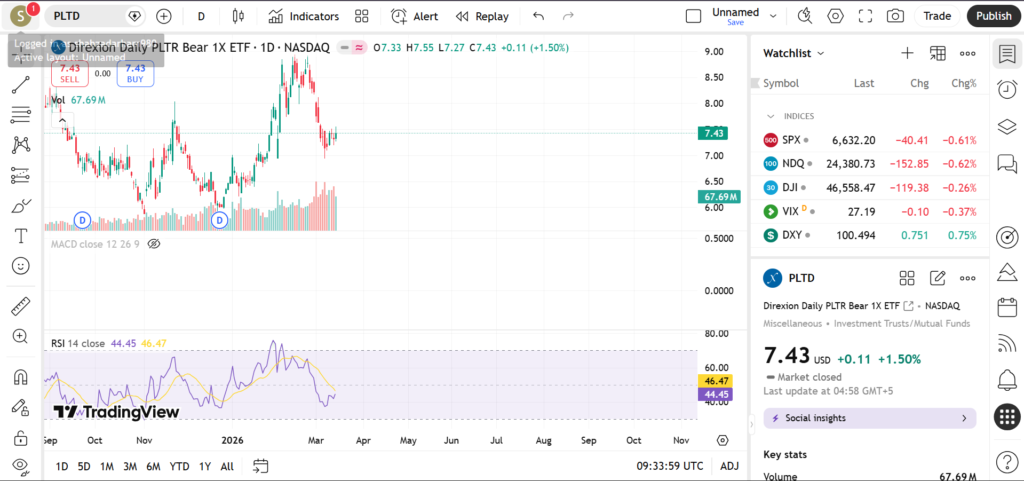
RSI readings for PLTD scream deeply oversold across periods, with 9-day at 6.15%, 14-day at 4.88%, and 20-day at 3.57%—levels below 10 often precede sharp relief bounces, though in inverse ETFs, this flags potential PLTR-fueled reversals.
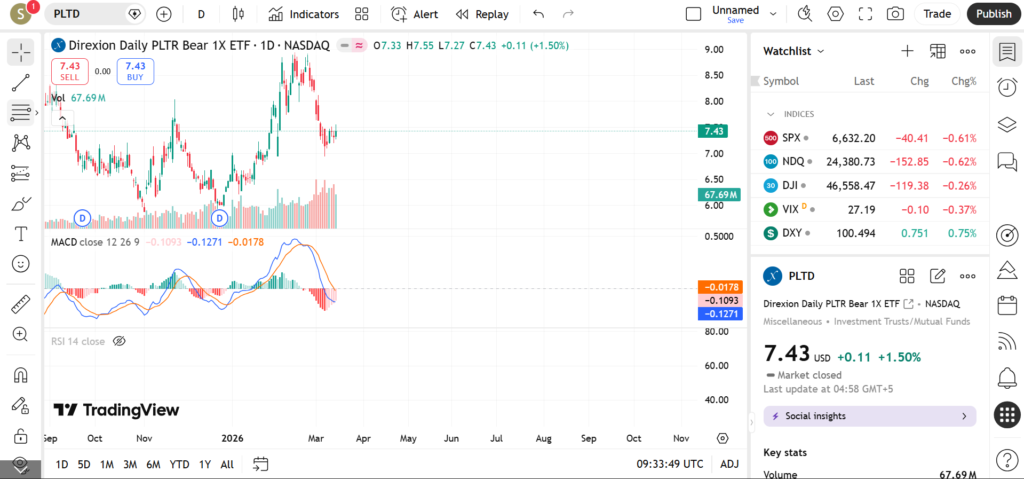
MACD likely shows bearish alignment with negative momentum (level below zero inferred from downtrend), contracting histogram suggesting fading downside velocity—traders monitor for bullish divergence if price stabilizes amid extreme Stochastic %K under 5%.
Volume surges on declines (e.g., average 9M+ shares recently) validate selling pressure, but lighter participation on minor upticks indicates weak conviction—watch for spike divergences, as climactic volume on lows could herald exhaustion in this high-volatility product.
Short-Term Outlook for PLTD in March 2026
PLTD’s technicals paint a bearish picture in March 2026, hammered by moving average breakdowns and oversold extremes tied to PLTR strength, though RSI oversold conditions hint at tactical bounce risks. Daily inverse reset favors short-term traders over holders, with PLTR catalysts dictating flow.
- Traders watch PLTR earnings reactions or AI contract news for volatility bursts.
- Hold below $7.50 resists bounces; break to $9+ needs PLTR pullback.
- Stochastic crossovers under 5% as early reversal clues.
- Broader tech sentiment (Nasdaq moves) amplifying single-stock leverage.
- Volume dry-up on further drops signaling potential exhaustion low.
Risks and Important Notes
Single-stock inverse ETFs like PLTD magnify losses from compounding, volatility decay, and PLTR-specific shocks like government contracts or hype cycles, easily breaking technical levels. High average true range (0.36-0.89) underscores intraday whipsaws—always prioritize stops, small sizes, and avoid overnight holds.
This content educates on technical patterns and inverse mechanics, not financial advice or predictions. Past charts don’t assure outcomes; blend with fundamentals and risk rules.
Explore related analyses on PLTU (PLTR Bull 2X ETF), QQQ tech trends, or single-stock leveraged peers. Subscribe for updates and trade with discipline!
Recommended places to insert 3 chart images:
- After the introduction: Daily chart for March 2026 showing price downtrend, 5/20/50-day moving averages, recent swings, and high volume on declines.
- Inside support/resistance section: 1-hour or daily chart with horizontal lines at $7.24 support, $7.70-$9.07 resistances, gaps, and MA overlays labeled.
- In the indicators section: Multi-panel daily chart featuring 14-period RSI (oversold), Stochastic, MACD histogram, and volume profile beneath price action.
Direxion Daily PLTR Bear 1X ETF Overview
PLTD seeks inverse daily returns to Palantir (PLTR) stock, thriving when PLTR declines amid AI hype cycles. This bear ETF suits traders hedging tech exposure.
March 2026 sees focus on PLTD as PLTR volatility persists post-earnings. Review covers trend, levels, RSI/MACD/volume for trade ideas.
Current Price Trend in March 2026
PLTD trends sharply higher (bullish for bear ETF) in March, above 20/50-day MAs after PLTR weakness, with 200-day NA due to newness. Swing highs build on downtrend in underlying.
Price action shows strong momentum, educating on leveraged decay—watch MA alignment for continuation.
Key Support and Resistance Levels
Supports for PLTD:
- Recent pullback lows near early March—volume-tested.
- 20-day MA—short-term dynamic floor.
- February gap fill—magnet level.
- 50-day MA—key for pullback depth.
Resistances:
- Near 20-day MA extensions—overbought cap.
- Swing high from mid-March—selling zone.
- 52-week progression highs.
- Round numbers overhead.
Upside breaks signal more PLTR downside; supports failing could pause rally.
Indicators – RSI, MACD, Volume
RSI overbought above 70, warning of pullback risk in PLTD’s strong run.
MACD bullish crossover with expanding histogram supports momentum.
High volume on advances validates, low on dips—healthy bull sign.
Short-Term Outlook for PLTD in March 2026
Bullish setup persists with indicators aligned, but overbought conditions temper enthusiasm.
- Resistance tests at swing highs.
- PLTR earnings or AI news catalysts.
- Support hold at 50-day MA.
- Volume confirmation needed.
Risks and Important Notes
Single-stock leverage amplifies losses; news can break levels. Manage risk.
Educational only—no advice.
See QQQ or PLTR bull analysis. Stay informed!