
Opendoor Technologies (OPEN stock) analysis covers latest price trends, earnings, technicals, and forecast. Is OPEN stock a buy? Get expert insights on valuation and outlook for investors.
Introduction
Opendoor Technologies runs an online platform that buys and sells homes directly from owners. It uses tech to speed up real estate deals. Investors watch OPEN stock now due to its recent rally and Q4 2025 earnings beat.
Housing market shifts and lower rates draw attention to iBuyers like Opendoor. Broader market conditions, like tech sector gains and real estate slowdowns, impact OPEN stock price.
Latest Stock Price & Trend
OPEN stock closed at $5.05 in the last market session, up from $4.97 prior close. It gained in the 1-day period amid high volume of 18.8 million shares.
The 5-day trend shows a 17% rise from lows around $4.61. Over one month, it climbed 27% from $4.26, though off recent highs of $5.87.
Three-month performance improved 27% from $4.26 lows, but down 34% from $8.26 peaks. Six-month trend reflects a 33% gain from $4.08, yet 50% below $10.87 top.
Year-to-date, OPEN stock rose 27% from $4.26 lows, despite 32% drop from $7.92 high. The 52-week range spans $0.51 low to $10.87 high, signaling high volatility.
This volatile uptrend points to bullish momentum for investors, but pullbacks remain likely in real estate plays.
Technical Analysis
Support levels sit near $0.51 from recent lows, where buyers often step in to halt declines. Resistance looms at $1.58-$5.18, past highs where sellers emerge.
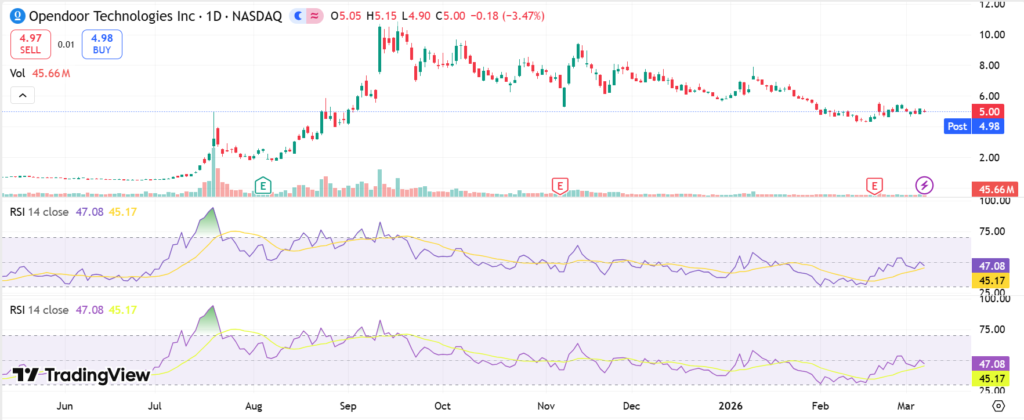
RSI at 82.9 shows overbought conditions, meaning the stock may pause or correct soon as momentum cools. MACD line above signal indicates bullish trend, supporting further upside if it holds.
The 50-day moving average tops the 200-day at 5.10 vs 2.36, a golden cross signaling strength. Trading volume trends up, with recent spikes confirming interest.
These indicators matter as they help spot entry points and reversal risks for beginners.
Analyst Ratings & Price Targets
Three analysts rate OPEN stock as Sell overall. Average price target stands at $1.67 to $4.50, with highs of $8 and lows of $1.
Recent actions include Citigroup maintaining Sell at $1.40 in Nov 2025 and Keefe Bruyette Underperform at $2. No major upgrades noted lately.
Wall Street sentiment leans cautious, implying downside risk for investors from current levels.
Insider Activity
Recent insider moves show mostly selling, like Chief Legal Officer Sydney Schaub’s 2.5K shares at $2.73 in Apr 2024 and Megan Meyer’s 46K shares at $2.59 in Mar 2024. No notable buying reported.
Transactions total small values under $120K each, routine for executives. Trends indicate ongoing sales, suggesting caution rather than strong confidence.
Valuation Analysis
Trailing P/E is not applicable due to losses, with EPS at -$1.70. Forward P/E unavailable, but revenue hit $4.37B TTM, down 15% YoY.
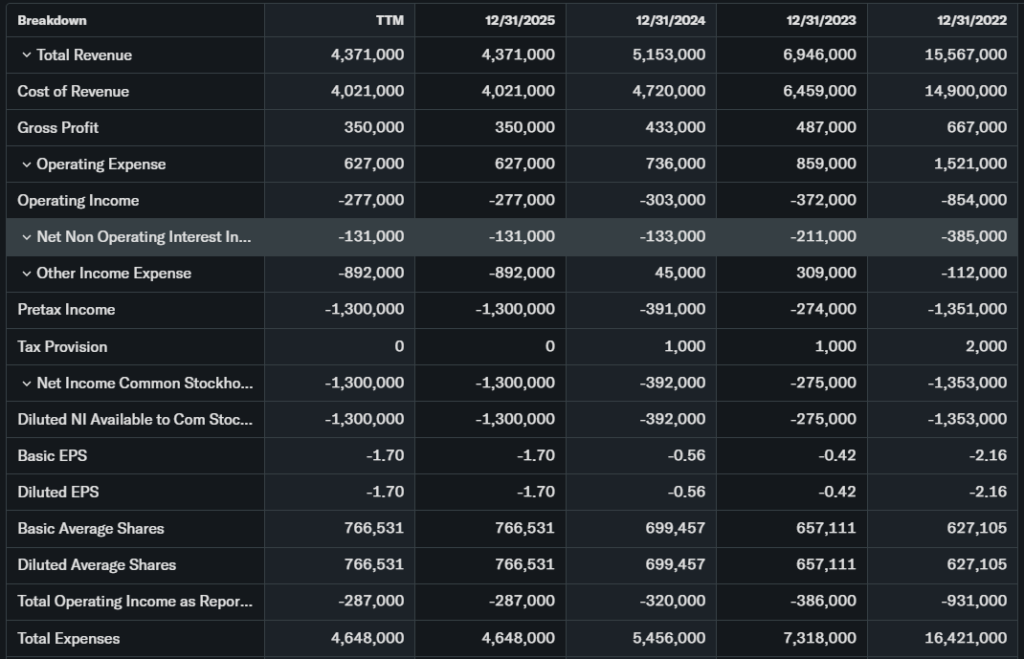

Price-to-sales around 1.1x exceeds peers at 0.8x and sector 0.9x. EPS growth expected from -$0.55 to -$0.51 next year; free cash flow negative amid $1.3B net loss.
Debt details limited, but inventory at $1.05B signals cash use. Compared to peers like Zillow, OPEN appears overvalued at current prices.
Recent Earnings & Catalysts
Q4 2025 revenue reached $736M, down from $1.08B YoY but part of Opendoor 2.0 plan. EPS beat estimates at -$0.07 vs -$0.10 expected.
Q3 revenue was $915M with $66M gross profit, missing some forecasts. Guidance eyes breakeven adjusted net income by end-2026, with 35% acquisition growth.
Catalysts include AI products, faster inventory turns (down 23%), and 46% QoQ home purchases. Earnings drove post-report gains on operational progress.
Bullish Case
Opendoor 2.0 boosts acquisitions 46% QoQ and cuts days in possession 23%. Housing demand could rise with rates, aiding revenue growth.
AI tools and software build leverage toward 2026 profitability. Strong cohorts like October 2025 support resale velocity.
Bearish Case
Revenue fell 15% TTM amid market slowdowns. Competition from Zillow and traditional agents pressures margins.
High short interest at 14.48% signals doubt; ongoing losses hit $1.3B. Regulatory or economic housing woes add risks.
Market Sentiment & Investor Psychology
Short interest covers 14.48% of float, or 118M shares, showing bearish bets. Institutional ownership at 49%, with Vanguard and Morgan Stanley top holders; steady trends.
Retail rallies like 175% weekly surge in 2025 reflect momentum chases. Sentiment mixes optimistic on ops but fearful on valuations: neutral overall.
Short-Term Outlook
Overbought RSI at 82.9 and resistance near $5.18 suggest pullback risks. Rising volume supports momentum if support holds at $4.95.
Watch Q4 guidance follow-through amid real estate data. Expect volatility without firm upside.
Medium to Long-Term Outlook
Solid business model via tech in iBuying, with industry growth from digitization. Competitive edge in AI, but peers challenge position.
Financial health improves toward breakeven, yet losses persist short-term. Long-term investors should watch for profitability proof before accumulating.
FAQ Section
Is OPEN stock a buy right now?
Analysts lean Sell with targets below $5; wait for pullback or earnings proof.
What is the price target for OPEN stock?
Averages $1.67-$4.50, implying downside from $5.05.
What are major risks for OPEN stock?
Revenue drops, losses, high shorts, and housing slowdowns.
What is OPEN stock forecast?
Short-term volatile; long-term tied to profitability by 2026.
OPEN technical analysis outlook?
Bullish MACD but overbought RSI signals caution.
Suggestions
- Compare with DVLT stock analysis
- See our real estate tech forecast
- Read our iBuyer sector valuation breakdown
Final Balanced Conclusion
Hold OPEN stock for now. Recent ops gains offer hope, but overvaluation, analyst sells, and insider sales warrant caution. Watch upcoming earnings on Feb 19, 2026.
Disclaimer: This article is for informational purposes only and not financial advice.