
IWM Technical Analysis: Trend, Levels & Outlook March 2026
The iShares Russell 2000 ETF (IWM) is one of the most widely followed exchange-traded funds tracking the Russell 2000 Index, which represents small-cap companies in the United States. Because these companies tend to be more sensitive to economic conditions than large-cap stocks, IWM is often used by traders and investors as a barometer for risk appetite and domestic economic growth.
In March 2026, IWM is drawing attention as market participants evaluate the outlook for smaller companies amid interest-rate uncertainty and shifting economic expectations. Small-cap stocks historically perform well during periods of economic expansion but may struggle when borrowing costs rise or growth slows. This article explores IWM’s current price trend, key support and resistance levels, technical indicators, and the short-term outlook traders are monitoring in March 2026.
Current Price Trend in March 2026
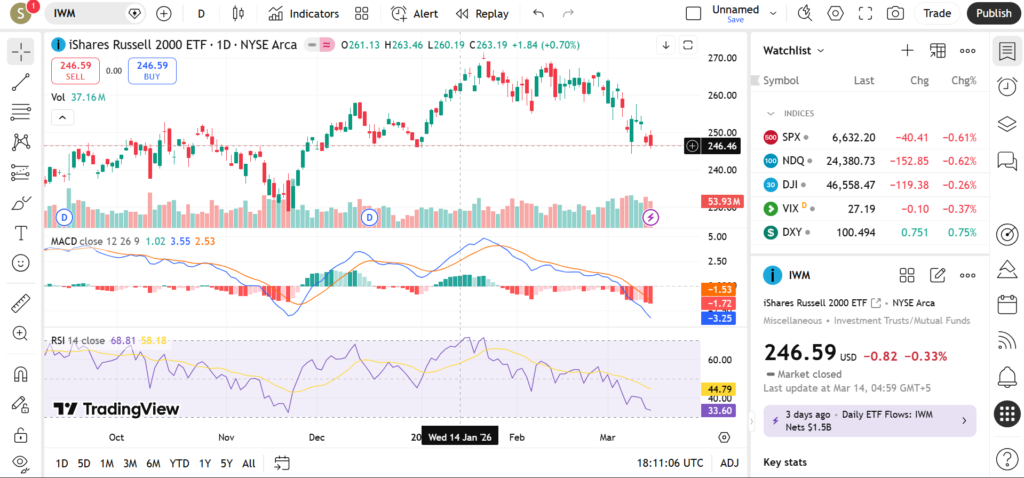
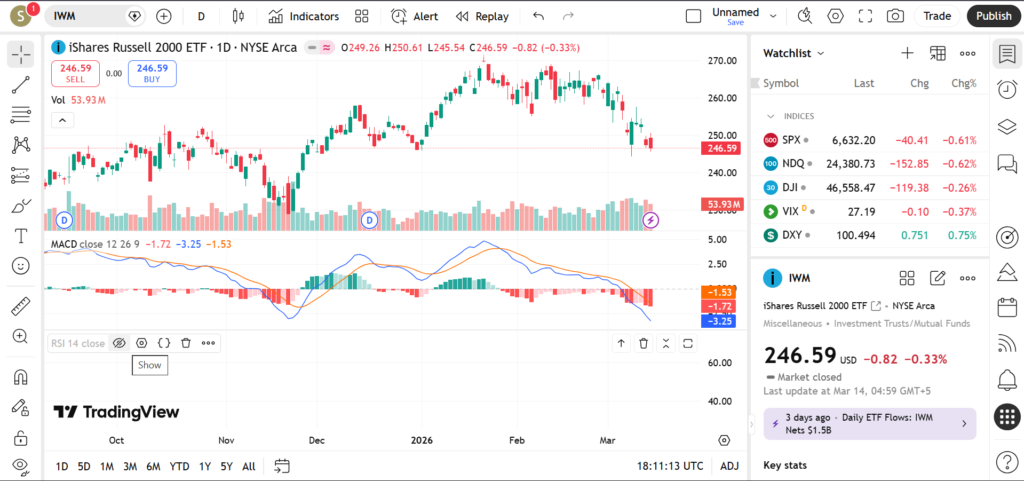
During March 2026, IWM has been trading in a sideways to slightly corrective trend following a period of strong performance earlier in the cycle. Price action indicates that the ETF has entered a consolidation phase where buyers and sellers are testing key technical levels before determining the next directional move.
The 20-day moving average has been acting as a short-term trend indicator, with price repeatedly testing this level during recent sessions. When the ETF trades above this moving average, short-term momentum tends to favor buyers. However, repeated breaks below it suggest that the market is currently lacking strong upward momentum.
The 50-day moving average sits slightly below recent highs and has served as an important pivot area during the past several weeks. In many cases, when price consolidates near the 50-day average after a rally, traders interpret it as a healthy pause rather than a trend reversal.
Meanwhile, the 200-day moving average continues to represent the long-term trend line for IWM. As long as price remains above this level, the broader structural uptrend that began in late 2025 could remain intact. A move below this long-term average would likely attract attention from institutional traders and long-term investors.
Recent price swings have shown lower highs forming near resistance zones, while dips have found support near prior consolidation areas. This type of price action suggests the ETF is building a range, which often precedes a breakout once new catalysts emerge.
Key Support and Resistance Levels
Support and resistance levels play an essential role in technical analysis because they highlight areas where price previously reversed or paused.
Important support levels for IWM in March 2026 include:
- Recent consolidation floor: This level represents the lowest point reached during the current trading range and has attracted buyers during recent pullbacks.
- 50-day moving average zone: This moving average often acts as dynamic support during moderate uptrends.
- 200-day moving average area: A major long-term technical level where institutional investors frequently monitor market direction.
On the upside, traders are watching several resistance levels:
- Recent swing high: The highest price reached during the current consolidation phase.
- Prior breakout zone: A level where price previously accelerated upward before encountering resistance.
- Psychological round-number resistance: Markets often react near round price levels because traders place orders around these numbers.
If IWM manages to break above its recent swing highs with increased volume, it could signal renewed optimism toward small-cap stocks. Conversely, a breakdown below the consolidation floor might suggest investors are becoming more cautious about economically sensitive companies.
Indicators – RSI, MACD, Volume
Momentum indicators help traders gauge whether price trends are strengthening or weakening.
The Relative Strength Index (RSI) for IWM has recently remained in the neutral range, typically between 40 and 60. This suggests that the ETF is not currently in overbought or oversold territory. Neutral RSI conditions often occur during consolidation periods, where markets are waiting for stronger catalysts.
The MACD indicator shows a gradual loss of momentum following earlier bullish signals. The MACD line has begun to flatten near the signal line, which may indicate slowing momentum rather than a strong reversal.

Volume behavior has been mixed. Some rallies have occurred with moderate volume increases, while certain pullbacks have also attracted trading activity. When volume rises during upward price moves, it generally suggests stronger participation from buyers. Conversely, rising volume during declines may indicate distribution.
For many traders, watching how volume behaves near key support and resistance levels can provide additional confirmation about the strength of a breakout or breakdown.
Short-Term Outlook for IWM in March 2026
The technical outlook for IWM in March 2026 suggests that small-cap stocks are currently in a consolidation phase, with traders awaiting clearer signals from economic data and broader market trends.
If price holds above its key moving averages and breaks above resistance levels, the ETF could potentially resume its upward trajectory. However, continued sideways movement may persist until new catalysts appear.
What traders are watching:
- Break above recent swing highs signaling renewed bullish momentum
- Whether price holds above the 50-day moving average
- U.S. economic data affecting small-cap growth expectations
- Interest-rate developments impacting borrowing costs
- Sector rotation between large-cap and small-cap equities
Risks and Important Notes
Technical levels can fail unexpectedly when markets react to major economic announcements, geopolitical developments, or corporate news. Small-cap stocks, which make up the Russell 2000 Index, can sometimes be more volatile than large-cap companies.
Additionally, shifts in interest-rate expectations may influence investor sentiment toward smaller companies that rely more heavily on financing.
This analysis is intended for educational purposes only and should not be considered personalized financial advice. Traders and investors should conduct their own research and consider risk management strategies when analyzing ETFs like IWM.
For additional market perspective, readers may also explore technical analysis of other index ETFs, sector ETFs, and volatility-related funds to understand how different segments of the market are performing