
iShares Russell 2000 ETF (IWM) Technical Analysis
The iShares Russell 2000 ETF (IWM) provides exposure to U.S. small-cap stocks via the Russell 2000 Index, spanning diverse sectors like industrials, financials, and healthcare. In March 2026, traders monitor IWM for signs of small-cap rotation amid large-cap dominance and economic policy shifts post-2024 election. This article details IWM’s trend, support/resistance zones, RSI/MACD/volume insights, and short-term trading considerations.
Small-caps in IWM often outperform during economic recoveries but lag in uncertainty, drawing focus now with potential rate cuts and fiscal stimulus discussions. As President Trump shapes pro-growth policies, IWM sensitivity to regional banks and cyclical names heightens its appeal for tactical plays.
Current Price Trend in March 2026
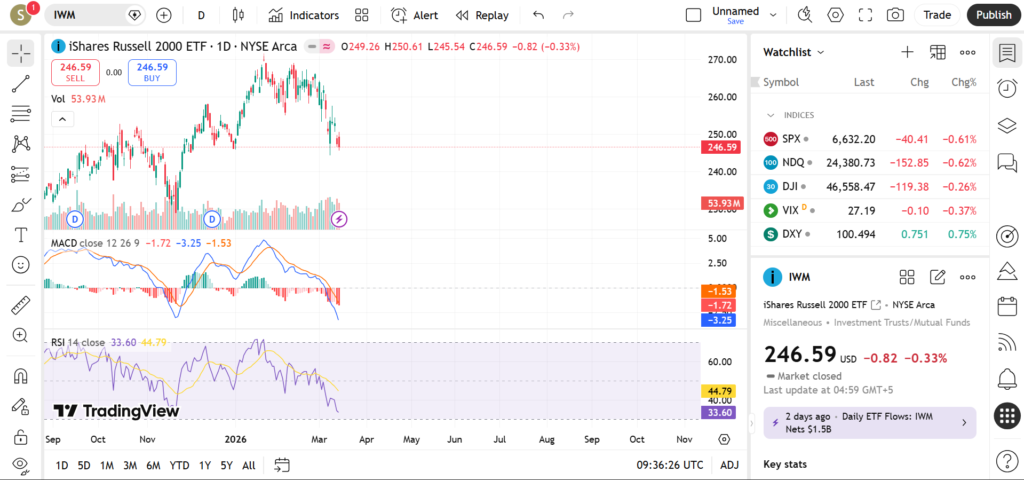
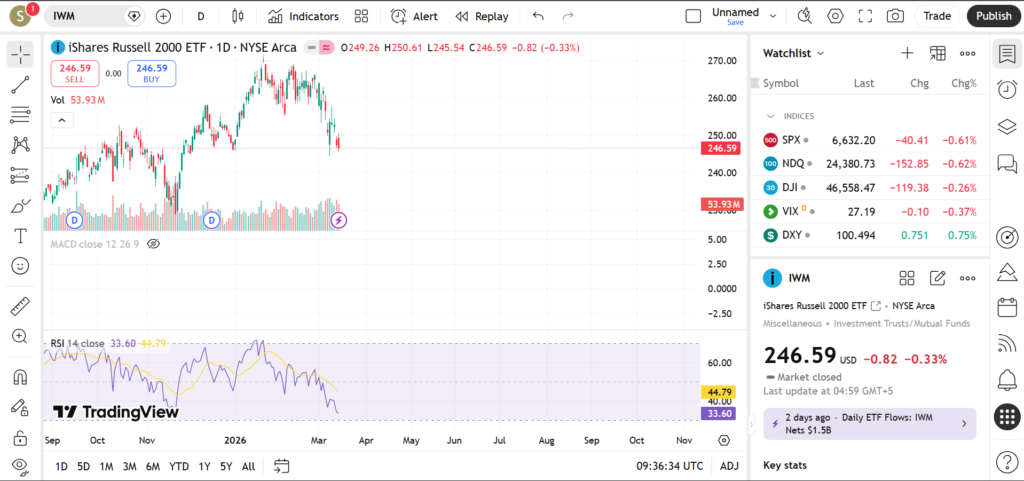
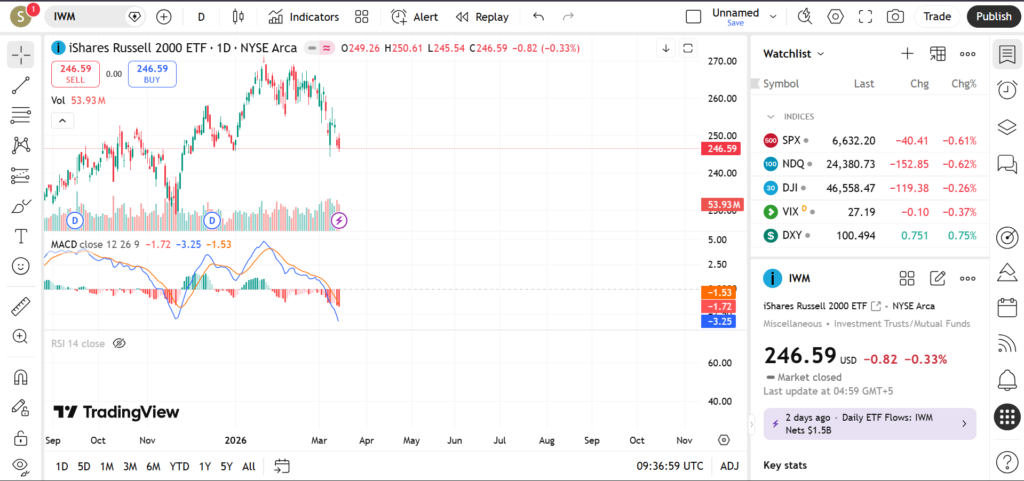
IWM displays a short-term downtrend in March 2026, with price carving lower highs after peaking earlier in the year, reflecting small-cap underperformance versus mega-caps. Recent action includes a sharp drop from February highs around 265-270, testing mid-range supports amid rising volatility.
The 20-day MA slopes downward, crossing below the 50-day, while the 200-day lags as distant support; key swings feature a rejection at 267 (period high) and a probe near 244 lows. This bearish alignment educates traders on trailing stops during momentum fades, without implying reversals.
Key Support and Resistance Levels
Supports for IWM anchor at recent lows and averages, where dip-buyers may emerge.
- Support near 245.00: Matches March low (244.39 extension) and 50-day MA approach; holding could stabilize, but breach might target 200-day, signaling deeper correction.
- Support at 240.00: Round number with prior gap and volume cluster; key test for bulls, as defense often sparks rebounds in small-cap indices.
- Support around 235.00: Aligns with 200-day MA and YTD pivot; failure here could indicate recessionary risks for small-caps.
- Support at 225.00: Multi-month low extension; major bearish signal if reached.
Resistances loom above, challenging recovery attempts.
- Resistance near 250.00: Recent consolidation zone and 20-day MA; break above might relieve downside pressure.
- Resistance at 255.00: 50-day MA convergence with swing high; penetration could target range midpoint.
- Resistance around 260.00: February peak extension; reclaiming signals uptrend resumption.
- Resistance at 267.00: Period high; decisive move above eyes 52-week highs.
Upside breaks may attract rotation flows, while support breaks could accelerate selling toward small-cap benchmarks.
Indicators – RSI, MACD, Volume
IWM’s RSI (14) trends oversold near 35-40 in March 2026, hinting at potential bounce opportunities but remaining below 50 amid downtrend pressure. Neutral-to-bearish readings advise against chasing lows without confirmation, as prolonged oversold can persist in weak markets.
MACD confirms bearish bias with a signal line crossover downward and contracting negative histogram, indicating fading momentum; watch for bullish divergence as a reversal clue. Crossovers in small-cap ETFs often precede volatility spikes.
Volume rises on down days—evident in March pullbacks—while drying up on minor rallies, underscoring seller control. Spikes near supports could foreshadow capitulation or absorption.
Short-Term Outlook for IWM in March 2026
IWM’s setup leans bearish short-term in March 2026, driven by downtrend, bearish MACD, and elevated volume on declines, though oversold RSI offers bounce potential near key supports. Small-cap lags persist amid macro rotation risks, but policy tailwinds could shift dynamics.
Traders eye oversold relief or further tests.
What traders are watching:
- 245 support hold versus Fed rate decision impacts.
- Volume reversal on bounce to 250 resistance.
- Russell 2000 earnings from financials/industrials.
- MACD histogram turn for momentum shift.
- Small-cap vs. S&P 500 relative strength amid GDP data.
Risks and Important Notes
IWM levels risk invalidation from surprise events like tariff announcements, bank stress, or inflation surprises, which amplify small-cap beta. Technicals falter against fundamentals, so diversify and use risk-defined strategies.
Educational content only—no advice; consult professionals and manage risks appropriately.
Check analyses on competitors like S&P SmallCap 600 ETF (IJR), growth peers (IWO), or value tilts (IWN) for broader small-cap context.