Analyze EEV ETF price, technical analysis, forecast, and ratings for 2026. Is EEV ETF a buy? Insights on UltraShort Emerging Markets trends and risks
Introduction
EEV ETF targets -2x daily returns of the MSCI Emerging Markets Index. It rises when EM stocks fall, serving as a hedge tool. Investors watch EEV ETF now amid China stimulus and EM rallies. Broader markets face U.S. tariffs and currency wars impacting inverse funds.
Latest ETF Price & Trend
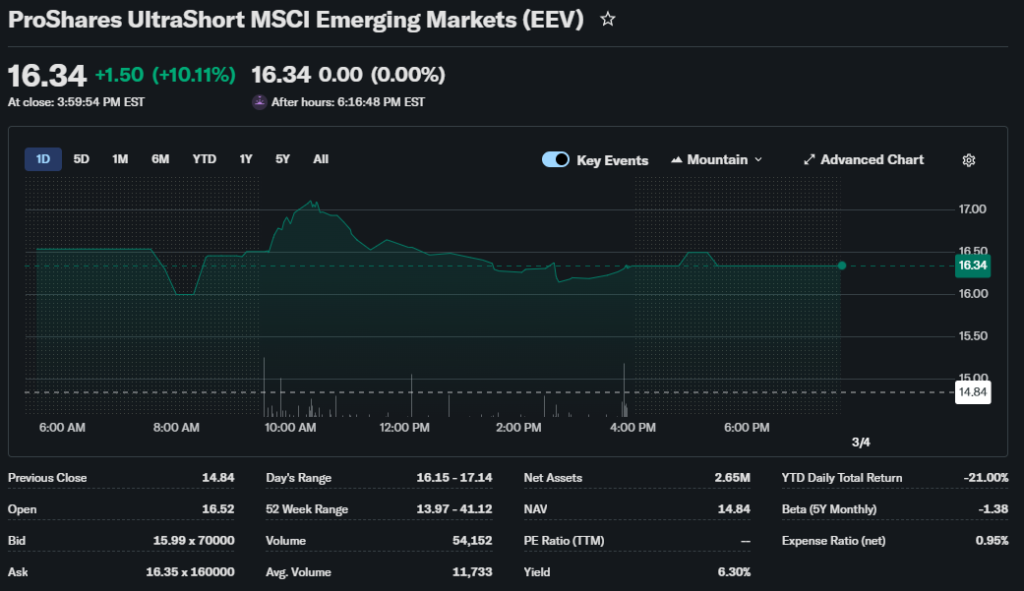
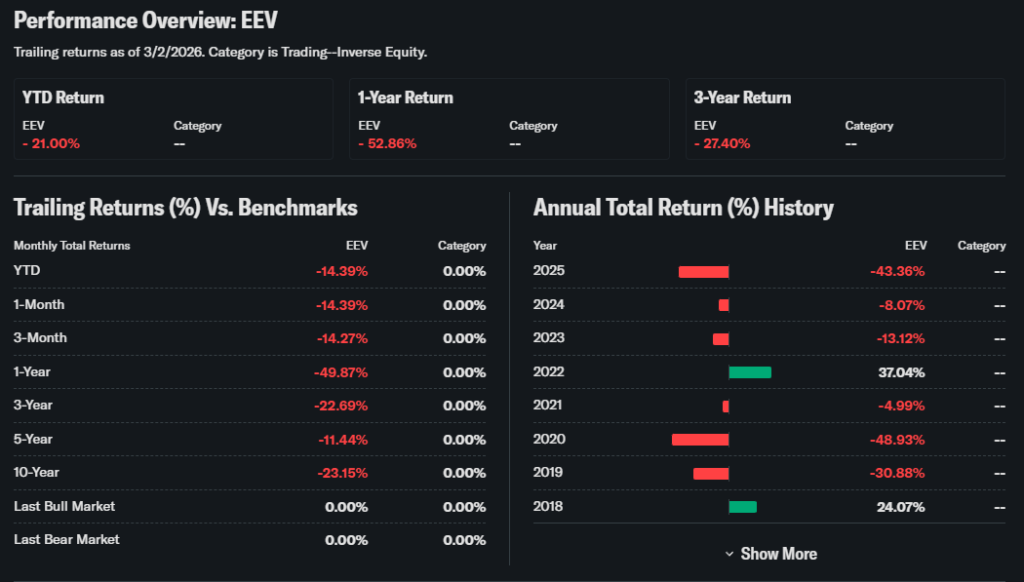
EEV ETF NAV closed at $14.34 on February 27, 2026 per ProShares data. Market price reached $14.36, up 0.6% that day. Five-day trend mixed; one-month down -14.39% as EMs climbed. Three-month fell -14.27%; six-month plunged -33.30%. Year-to-date shows -14.39% through late February. 52-week high near $25, low around $14. Overall bearish path reflects EM strength crushing shorts. This signals tactical opportunities with high decay risk for holders.
Technical Analysis
Support levels hold at $14.00, recent trading floor. Resistance sits at $15.50 from prior peaks. RSI neutral after declines, avoiding extremes. MACD shows bearish continuation on downtrend. 50-day average above price; 200-day confirms long-term death cross.
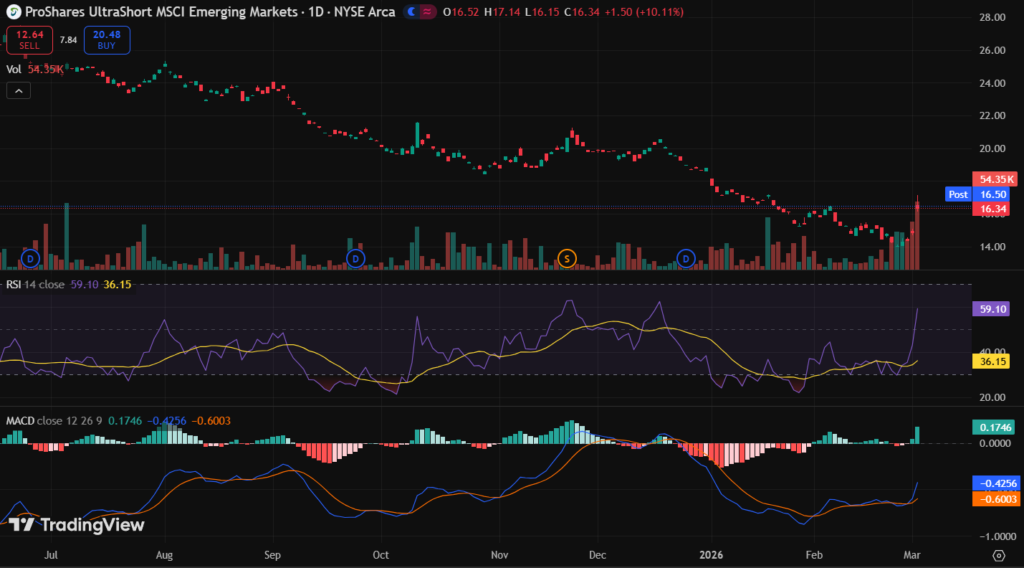
Trading volume steady at 23,449 shares daily. Support catches falling prices for potential bounces. Resistance caps recovery attempts. RSI measures momentum extremes for timing. MACD reveals trend strength via line crosses. Moving averages smooth price action; crosses predict shifts. Volume validates move conviction.
Analyst Ratings & Price Targets
No formal Wall Street ratings cover niche EEV ETF. ProShares frames it as short-term trading vehicle. Price targets range $13 support to $16 resistance levels. No upgrades/downgrades tracked. Sentiment emphasizes tactical use over investment holds. Investors should note timing challenges with leverage.
Insider Activity
ETFs like EEV ETF track fund flows rather than insiders. Recent 1-year flows show $791K inflows despite performance drag. AUM remains low around $21M. Steady creation units suggest persistent hedging demand. This indicates tactical confidence amid EM strength.
Valuation Analysis
EEV ETF lacks traditional P/E as inverse leveraged product. Expense ratio 0.95% with waiver through September 2026. NAV trades slight premium at current levels. No revenue growth, EPS, or cash flow metrics apply directly.
Swaps provide -2x exposure to EM index. Compared to EUM or EFZ peers, EEV matches high costs. Appears fairly valued for its niche hedging role.
Recent Earnings & Catalysts
ETFs report no quarterly earnings. EEV performance ties inversely to EM index moves. China property stimulus and commodity rallies lifted EMs, crushing EEV. No formal guidance exists. Index strength drove EEV ETF price down 49.87% over past year.
Bullish Case
EM overvaluation invites corrections. EEV ETF doubles those declines daily. U.S. tariffs hit China exports. Dollar strength pressures EM currencies. Recession fears trigger risk-off flows.
Bearish Case
Leverage causes decay in sideways markets. 0.95% fees compound long-term losses. EM bull market persists on stimulus. Low AUM creates liquidity gaps. Global growth surprises favor longs.
Market Sentiment & Investor Psychology
Short interest minimal due to ETF structure. Options activity sparse on low volume. Institutional ownership steady at reduced AUM levels. Retail chases EM momentum trades. Overall sentiment fearful for shorts, optimistic for EM bulls.
Short-Term Outlook
Support test at $14.00 looms important. Neutral RSI allows volatility swings. Volume trends flat suggest consolidation. EM data releases drive near-term direction.
Medium to Long-Term Outlook
Inverse design fits tactical trades only. EM growth accelerates via China rebound. Competitive position weakens versus long funds. Performance health requires sustained downturns. Long-term investors should watch EM peaks, avoid accumulation.
FAQ Section
Is EEV ETF a buy right now?
Watch for EM tops; tactical hedge only.
What is the price target for EEV ETF?
$13-16 range based on key levels.
What are major risks for EEV ETF?
Daily decay, EM rallies, low liquidity.
EEV ETF forecast short term?
Choppy trading near support zone.
EEV technical analysis summary?
Support $14, death cross active, volume steady.
Suggestions
- Compare with SOXS Emerging Markets ETF.
- See our China stimulus forecast.
- Read inverse leveraged ETF guide.
Conclusion
Watchlist EEV ETF for short-term hedges. Gains possible during EM corrections but structural decay limits appeal. Best for experienced traders.
Disclaimer: This article is for informational purposes only and not financial advice.