
Explore EEM ETF price, technical analysis, forecast, and if EEM ETF is a buy. Get valuation, earnings insights, and emerging markets outlook as of March 2026.
Introduction
The EEM ETF tracks large- and mid-cap stocks from emerging markets via the MSCI Emerging Markets Index. It holds over 1,400 companies, mainly from Taiwan, South Korea, China, and India.
Investors watch EEM ETF now due to a 25% rise last year amid dollar weakness. Broader conditions like U.S. rate cuts and China stimulus boost emerging market appeal.
Latest EEM ETF Price & Trend
EEM ETF closed at $62.71 on February 26, 2026, down 0.95% that day. The 52-week range spans $38.19 low to $65.96 high, showing strong recovery.
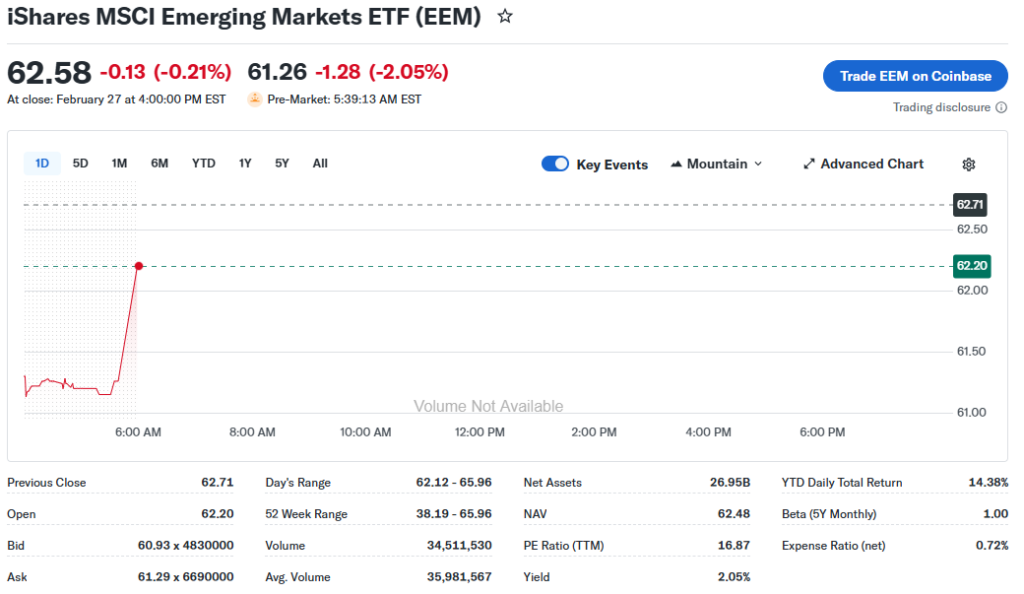
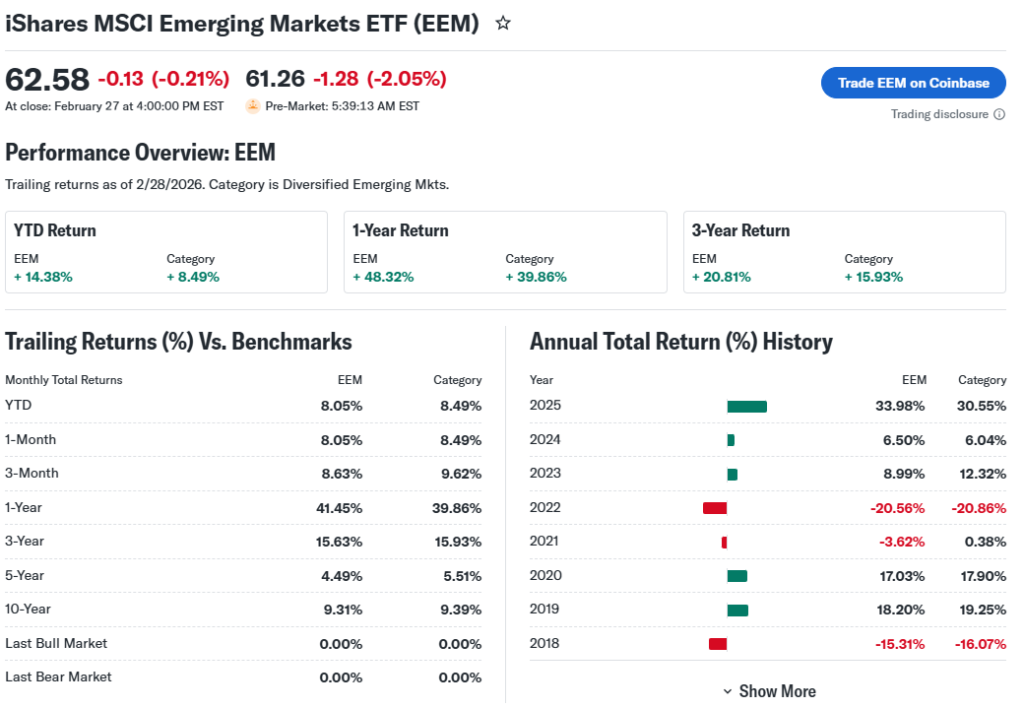
Year-to-date, EEM ETF gained about 11.70% from $55.81. Over three months, it rose 19.01%; six months up 26.33%. One-month trends show gains near 8%, aligning with category averages.
The overall trend looks bullish, trading near highs with steady climbs. This signals opportunity for investors eyeing growth in developing economies, but watch U.S. dollar shifts.
Technical Analysis
Support levels are key floors where buying may emerge, like $59.40 for EEM ETF. Resistance at $65.23 acts as a ceiling sellers target. Breaching these shows momentum shifts.
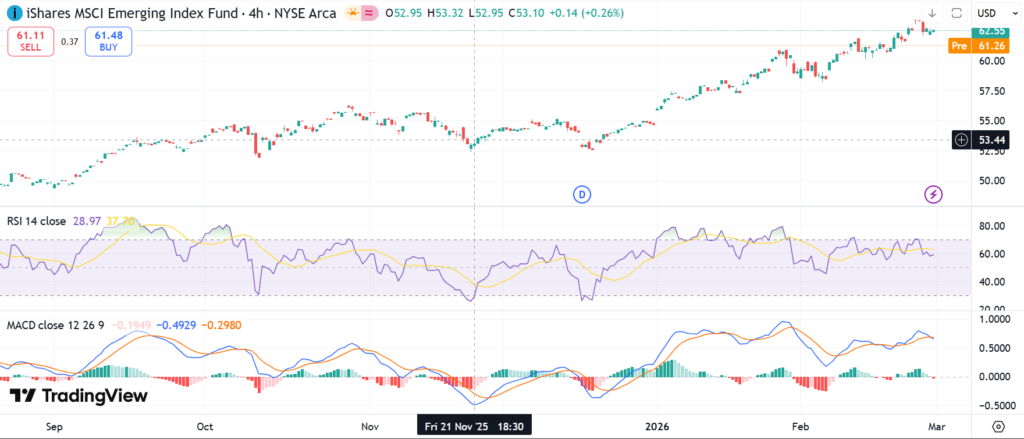
RSI at 64 indicates neutral momentum—not overbought above 70 or oversold below 30. MACD at 1.21 gives a buy signal, tracking short-term trends via moving average differences.
EEM ETF sits above its 50-day moving average (~$57.70) and 200-day (~$52.80), a bullish sign. No recent golden cross (50-day over 200-day), but uptrend persists. Volume averaged 19.8 million shares, supporting gains.
Analyst Ratings & Price Targets
Holdings in EEM ETF earn a moderate buy from 28 ratings: more buys than holds or sells. Average price target is $54.92, with highs and lows similar.
No major recent upgrades noted for key holdings. Wall Street sees balanced views, with optimism on China and tech exposure.
This sentiment suggests caution short-term but growth potential, guiding everyday investors.
Insider Activity
ETFs like EEM lack direct insiders, but holdings show trends. No specific recent buying or selling data highlighted for top names like TSMC or Samsung.
Institutional ownership is strong at 1,559 owners holding 325 million shares long. This implies confidence from big players in emerging markets.
Valuation Analysis
EEM ETF’s trailing P/E is around 17.44, with some data at 5.38—low versus historical medians. Price-to-sales not directly listed, but PB ratio at 0.9 signals undervaluation.
Revenue growth ties to holdings like TSMC (semiconductors) amid AI demand. EPS growth supports 25% annual returns. Free cash flow and debt vary by company; overall healthy with $29.8B assets.
Compared to U.S. peers like Microsoft (higher P/E), EEM ETF appears undervalued for growth seekers.
Recent Earnings & Catalysts
ETFs report no earnings, but holdings drove performance. Top weights: TSMC 13.27%, Samsung 5.66%, Tencent 3.67%. Recent quarters showed strength in tech amid global demand.
Catalysts include China stimulus and weaker USD boosting returns. AI integrations in holdings like SK Hynix fueled 39% 2025 surge. This lifted EEM ETF price significantly.
Bullish Case
Emerging markets demand rises with global trade recovery. Tech advantages in Taiwan and Korea holdings drive revenue.
Dollar weakness to mid-2026 favors EEM ETF. Operational gains in top firms like Alibaba add stability.
Bearish Case
Competition from U.S. tech pressures margins. Slowing China growth and geopolitical risks loom.
Regulatory hurdles in India, Brazil add caution. Economic slowdowns hit customer spending.
Market Sentiment & Investor Psychology
Short interest at 16.49% of float shows some bearishness. Institutional trends rose slightly, holding steady.
Options data limited, but volume trends support bulls. Sentiment leans optimistic on momentum.
Short-Term Outlook
Technicals like RSI neutral and MACD buy favor upside. Volume holds firm; momentum from USD trends aids.
Expect sideways to mild gains unless resistance breaks.
Medium to Long-Term Outlook
Strong business models in diversified holdings shine. Industry growth in EM equities projected solid.
Financial health good; watch competition. Long-term investors should hold or accumulate on dips.
FAQ Section
Is EEM ETF a buy?
Moderate buy on holdings; undervalued with growth potential.
What is the EEM ETF price target?
Aggregate around $54.92, but recent highs suggest higher.
What are major risks for EEM ETF?
Currency swings, geopolitics, China slowdown.
EEM ETF forecast 2026?
Rocket potential from weak dollar, EM recovery.
Suggestions
Compare with SOXS ETF analysis
See our IEMG ETF forecast
Read emerging markets sector breakdown
Conclusion
Hold EEM ETF. Bullish trends and valuation outweigh risks in growing EM space, but diversify.
Disclaimer: This article is for informational purposes only and not financial advice.