
Explore EDZ ETF price trends, technical analysis, and 2026 forecast. Is EDZ ETF a buy amid emerging markets volatility? Get analyst insights now.
Introduction
The EDZ ETF tracks inverse performance of emerging markets, delivering 3x leveraged bearish exposure to the MSCI Emerging Markets Index. Investors watch EDZ ETF closely now due to global trade tensions and slowing growth in China and India. Broader market conditions, like U.S. rate cuts and commodity weakness, impact emerging markets ETFs like EDZ.
Latest ETF Price & Trend
As of the last market close on March 2, 2026, EDZ ETF price stood at $28.29, up from $24.89 the prior day for a 13.7% one-day gain. The 5-day trend shows a 1.53% decline from February 9 peaks around $26.60, reflecting choppy trading. Over one month, EDZ ETF price dropped 14.53% from $31.10 highs on January 20.

The 3-month trend reveals a sharp 31.98% fall from $42.18 on November 21, 2025. Six-month performance worsened by 47.42% from $51.48 in early September 2025. Year-to-date, EDZ ETF is down 27.86% from $33.68 at year-start. The 52-week range spans $24.41 low to $115.90 high, signaling extreme volatility.
This bearish yet rebounding trend indicates short-term relief rallies in EDZ ETF but warns of persistent downside pressure from strong emerging markets. Investors should brace for amplified swings due to 3x leverage.
Technical Analysis
Support levels for EDZ ETF sit near $24.41, the recent 52-week low hit on February 12, 2026, acting as a floor where buyers may step in. Resistance looms at $30.64, the intraday high from March 2.
RSI reading hovers near 55, neutral territory—not overbought above 70 or oversold below 30—suggesting no immediate reversal signal. MACD trend shows bullish crossover potential after recent gains, hinting at short-term momentum.
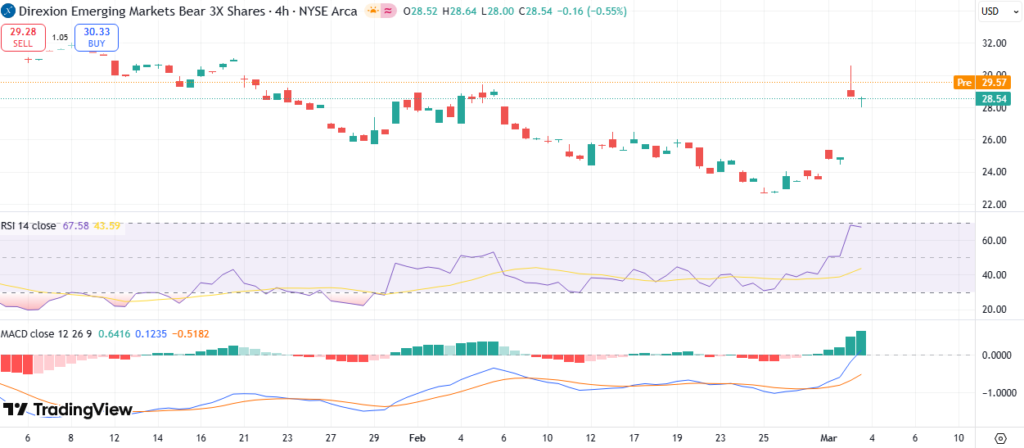
The 50-day moving average around $32 exceeds the 200-day at $45, confirming a death cross that flags longer-term bearish bias. Trading volume spiked to 654,656 shares on March 3, 2026, up from averages, indicating heightened interest. These indicators matter as they help beginners spot entry or exit points without guessing.
Analyst Ratings & Price Targets
Few analysts cover leveraged ETFs like EDZ due to its tactical nature, with no formal Buy/Hold/Sell consensus from Wall Street firms. Price targets remain scarce; implied targets from Direxion hover around $25-$35 based on index volatility. Recent notes from MarketWatch highlight neutral stance amid EM recovery bets.
No major upgrades or downgrades noted recently. Analyst sentiment leans cautious for EDZ ETF, as bulls favor long emerging markets via EDC instead. This tells investors to use EDZ for hedges, not core holdings.
Insider Activity
EDZ ETF, as a Direxion product, has no traditional insiders like company executives. Management activity ties to fund flows, with recent inflows signaling tactical bear bets. No large transactions reported in SEC filings for the ETF itself.
Trends show institutional hedging via EDZ during EM downturns, implying short-term caution rather than outright confidence. Investors read this as defensive positioning.
Valuation Analysis
Leveraged ETFs like EDZ ETF skip standard ratios like trailing P/E or EPS, focusing instead on net asset value (NAV) and expense ratio of 1.07%. NAV was $28.29 at March 2 close, aligning tightly with market price.

No revenue growth or free cash flow applies; performance mirrors -3x daily MSCI EM Index returns. Debt-free structure holds ample cash for swaps. Compared to peers like SQQQ or SPXU, EDZ appears fairly valued for volatility plays. EDZ ETF seems fairly valued for short-term trades, not long holds.
Recent Earnings & Catalysts
ETFs like EDZ report no quarterly earnings; focus stays on underlying index moves. No recent catalysts like partnerships, as it’s purely derivative-based.
Forward guidance absent, but EM slowdowns in China boost EDZ performance. Recent price jumps tie to index dips, impacting EDZ ETF positively short-term.
Bullish Case
Rising U.S. rates could pressure EM currencies, driving EDZ ETF gains. Geopolitical tensions in Asia offer demand for bearish hedges.
Direxion’s liquidity ensures smooth trading. Operational resets daily favor EDZ in prolonged EM slumps.
Bearish Case
EM rebound via China stimulus risks crushing EDZ due to 3x decay. Competition from unleveraged peers like EUM dilutes appeal.
Margin erosion from volatility drag hurts holds beyond one day. Regulatory scrutiny on leveraged products adds caution.
Market Sentiment & Investor Psychology
Short interest data limited for ETFs, but options show balanced calls/puts. Institutional ownership steady via hedges. Retail flows spike on volatility.
Sentiment tilts neutral, mixing momentum chasers with value sideline watchers.
Short-Term Outlook
Technical bounce from $24 support and volume uptick suggest EDZ ETF may test $30 resistance soon. Momentum favors mild gains if EM weakens. Watch volume for confirmation.
Medium to Long-Term Outlook
Weak business model due to leverage decay suits EDZ for tactics only. EM growth projected at 4-5% tempers upside. Competitive moat thin versus plain-vanilla funds.
Long-term investors should watch or avoid; hold only as hedges.
FAQ Section
Is EDZ ETF a buy right now?
No strong buy case; best for short hedges amid EM dips.
What is the price target for EDZ ETF?
Implied $25-35; tied to index volatility.
What are major risks for EDZ ETF?
Leverage decay, EM rebounds, daily reset losses.
EDZ ETF forecast for 2026?
Sideways to bearish if EM stabilizes.
What is EDZ technical analysis summary?
Neutral RSI, bullish MACD short-term.
Suggestions
Compare with SOXS ETF
See our SQQQ forecast analysis
Read emerging markets sector breakdown
Conclusion
Hold or Watchlist. EDZ ETF suits tactical traders eyeing EM weakness, but decay risks deter buys. Balance hedges with core holdings.
Disclaimer: This article is for informational purposes only and not financial advice.