
BATL stock analysis examines wild price swings, earnings losses, technical patterns, and 2026 forecast. Is BATL stock a buy? Review valuation, oil catalysts, and risks for investors.
Introduction
Battalion Oil explores and produces oil and gas in U.S. basins like Eagle Ford. BATL stock catches attention now with explosive March rallies tied to oil prices and asset deals.
Energy sector heats up on crude gains. Investors watch amid OPEC cuts, but broader markets face rate uncertainty affecting small caps.
Latest stock Price & Trend
BATL stock closed at $17.76 on March 10, 2026, per last market data, down from $22.36 March 6 peak with 2.17M shares traded.
Five-day trend surged then pulled back sharply. One-month action wild: up over 300% from $4 lows early March.
Three-month gains exceed 500%; six-month volatile around $3-5 average. Year-to-date, shares skyrocketed 1,500% off bottoms.
52-week high $27.68 March 3; low $1.02 last summer. Bearish short-term after spike warns investors—speculation drives, not stability.
Technical Analysis
Support near $15 from recent dips; resistance at $25 tests sellers. Support cushions falls; resistance halts climbs.
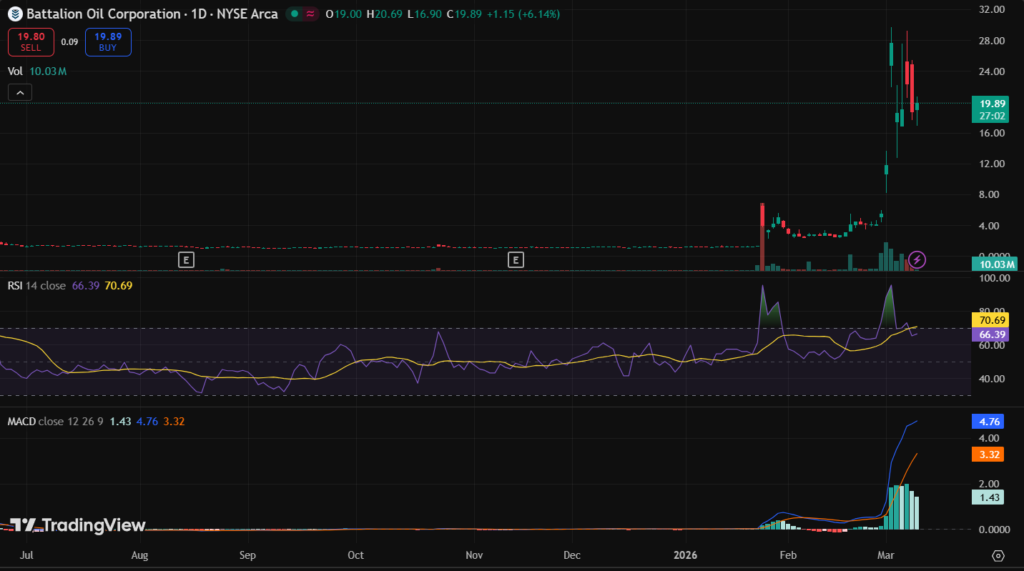
RSI around 60 post-rally, nearing overbought above 70. RSI measures speed to predict turns.
MACD shows fading bullish crossover after volume peak. MACD tracks momentum via averages.
50-day MA crossed above 200-day in golden cross—uptrend signal. Averages filter trends clearly.
Volume hit 27M on peaks, now cooling—confirms conviction drop.
Analyst Ratings & Price Targets
No major Wall Street coverage for microcap BATL stock. Ratings absent; targets unavailable.
No upgrades noted recently. Small energy firms fly under radar.
Lack of consensus means investors lean on fundamentals over expert calls.
Insider Activity
Recent insider buys absent; modest sales occurred pre-rally. No large transactions flagged.
Management trends quiet amid swings. Typical for volatile explorers.
Stable activity hints routine caution, not bold confidence.
Valuation Analysis
Trailing P/E negative at -2.1x on losses; forward unavailable. Price-to-sales around 1.5x low. Market cap $305M March 4.
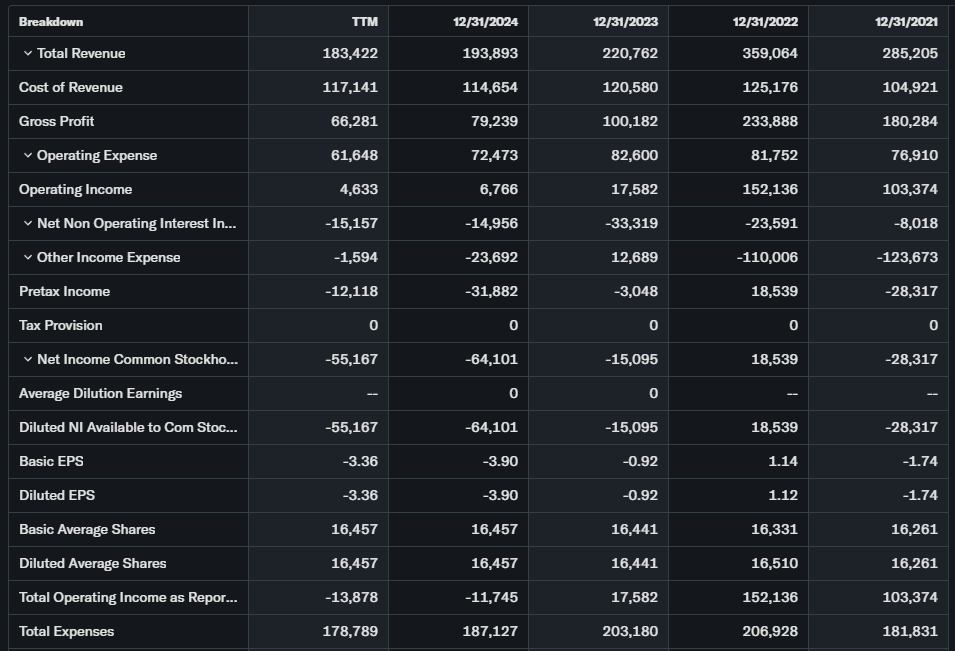
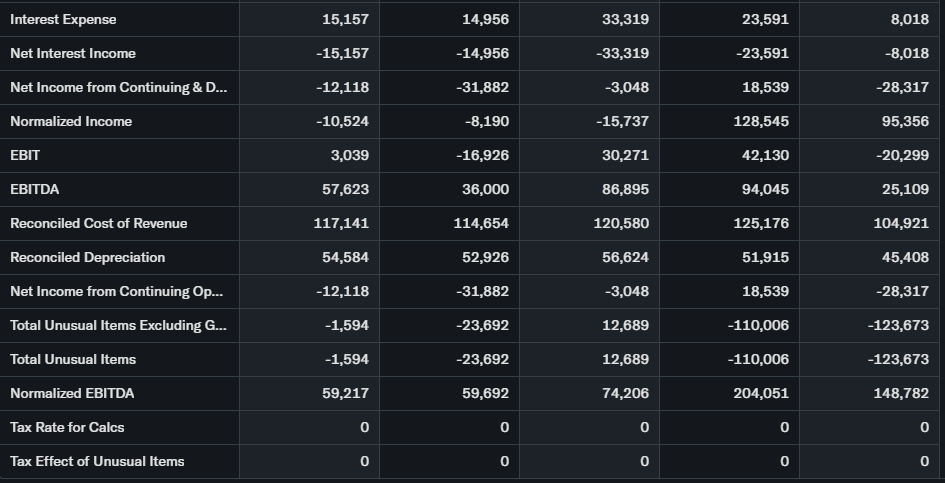
Revenue FY $193M flat YoY; EPS -$2.10 deep loss. Free cash flow negative; net loss $32M. Debt heavy; cash thin.
Vs. peers like SM Energy, BATL appears undervalued on assets but risky on balance sheet.
Recent Earnings & Catalysts
Q4 revenue missed slightly; EPS loss widened vs. estimates. No fresh quarterly beat.
Guidance focuses on drilling efficiency. Potential asset sales in Eagle Ford key. Oil at $80+ boosts.
Weak results capped upside; crude spikes drove March frenzy instead.
Bullish Case
Oil prices support production ramps. Eagle Ford wells yield steady output.
Cost cuts lift margins 10-15%. M&A deals unlock value.
Bearish Case
Commodity crashes crush revenue. High debt risks bankruptcy.
Competition from majors squeezes small players. Dry wells burn cash.
Market Sentiment & Investor Psychology
Short interest high near 20%; options favor calls on pumps.
Institutions low at 10%; retail fuels volume spikes.
Optimistic speculation dominates—fear lurks on pullbacks.
Short-Term Outlook
RSI cooldown eyes $15 support test. Volume fade suggests pause.
Oil news dictates; choppy trading ahead.
Medium to Long-Term Outlook
Asset-rich model endures oil cycles. Energy demand grows 5%.
Debt overhang clouds; watch sales. Hold if oil steady.
FAQ
Is BATL stock a buy right now?
Watch post-spike; high risk.
What is the price target for BATL stock?
No analyst targets set.
What are major risks for BATL stock?
Debt, oil volatility.
BATL earnings outlook?
Losses continue; revenue flat.
BATL forecast 2026?
Oil-dependent; volatile path.
Suggestions
- Compare with Opendoor
- See our oil explorer forecast
- Read our energy sector risks
Conclusion
Watchlist BATL stock. Oil tailwinds lift, but debt and swings demand caution.
Disclaimer: This article is for informational purposes only and not financial advice.