
Explore TSLL ETF price, technical analysis, forecast, and if TSLL ETF is a buy. Get insights on Direxion Daily TSLA Bull 2X Shares for smart investing decisions.
Data as of April 21, 2026 — Last market close data used.
Introduction
TSLL ETF tracks 2x the daily performance of Tesla stock.
It appeals to traders seeking leveraged exposure to TSLA moves.
Investors watch TSLL ETF now due to Tesla’s EV market shifts and AI hype.
Tech sector volatility from tariffs and rates impacts TSLL ETF price.
Tesla’s robotaxi plans draw focus amid broader market caution.
ETFs like TSLL ETF amplify single-stock risks in choppy times.
Latest ETF Price & Trend
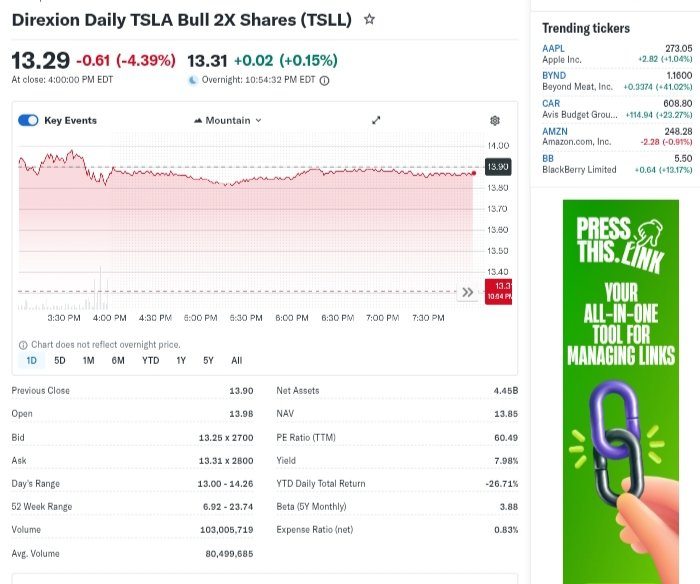
TSLL ETF closed at $13.68 on April 20, 2026.
It rose 4.4% from the day’s low of $13.10 but fell 5.2% from the high of $14.43.Volume hit 27.23 million shares, above the average 71.33 million.
Over five days, TSLL ETF price shows short-term recovery attempts.
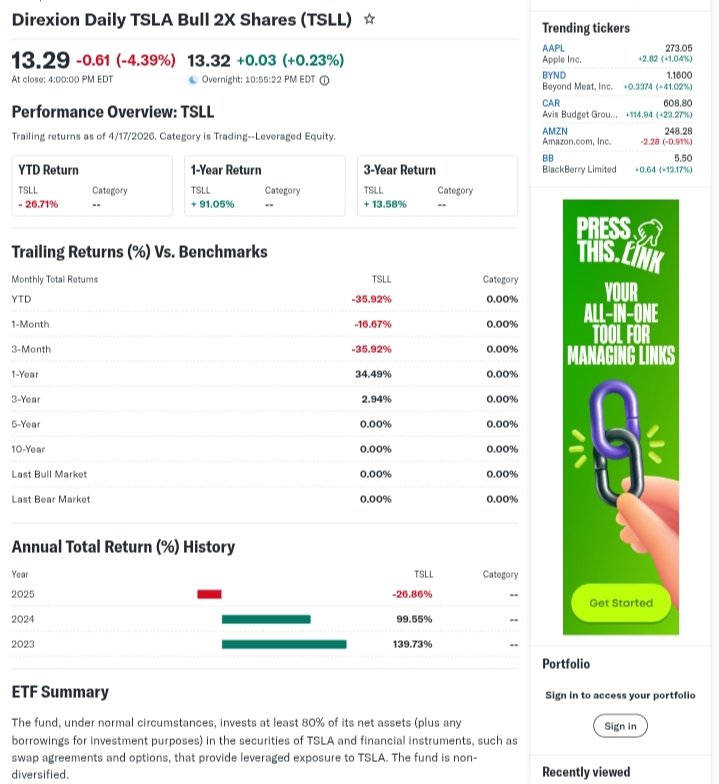
One-month trend sits neutral at around 14% gain per recent data.
Three-month performance lags with NAV up just 2.64%.
Year-to-date, TSLL ETF dropped 20.10% at market close.
52-week high nears $14.43 recently, low around $7.44
Six-month trend leans bearish at -19.95% NAV return.
Overall direction stays sideways to bearish.
This signals caution for investors; leverage magnifies Tesla’s stalls
Technical Analysis
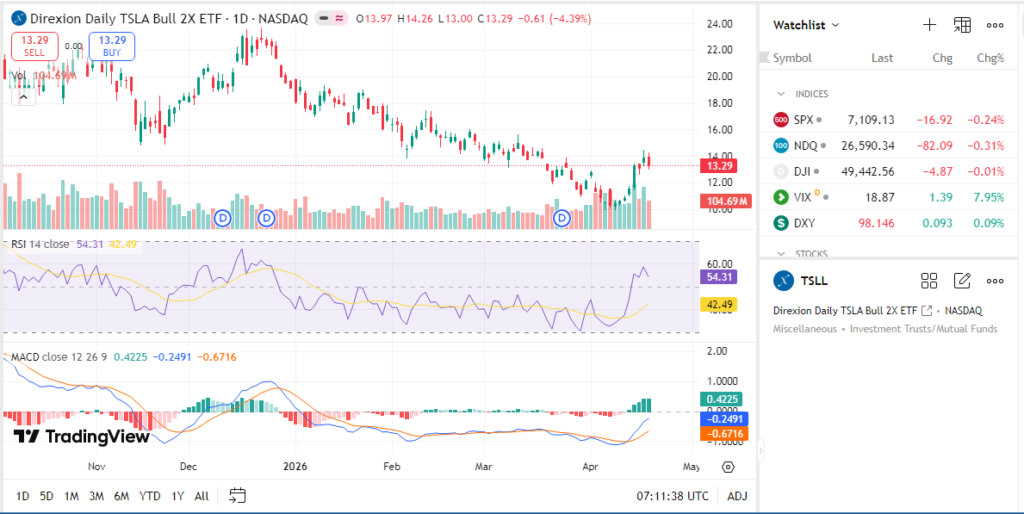
Support levels rest at $9.49, with deeper aid at $7.44 Fibonacci.
Resistance caps at $14.01; break signals bull run.
RSI at 58.63 shows neutral, not overbought above 70 or oversold below 30.
RSI measures speed of price changes to spot reversals.
MACD at -0.37 issues sell for short-term momentum.
MACD tracks trend strength via moving average crossovers.
50-day moving average hovers near $14.27; TSLL trades below.
200-day at $16.10 confirms longer bearish bias.golden cross ; death cross lingers.
Volume trends high but erratic, aiding quick swings.
These point to TSLL technical analysis favoring waits over buys now.
Analyst Ratings & Price Targets
Few traditional ratings cover leveraged ETFs like TSLL ETF.
Zacks ranks it Hold (3), eyeing 6-month timeliness.
No broad Wall Street targets; focus stays on underlying TSLA.
Recent signals mix: MACD sell, RSI neutral per tools.
Direxion notes 0.95% expense ratio, no upgrades noted.
Sentiment implies caution; leverage suits short holds only.
Insider Activity
TSLL ETF lacks direct insiders as it’s Direxion-managed.
Activity ties to Tesla execs, but no fresh large buys/sells flagged.
Tesla patterns show mixed confidence; monitor SEC filings.
No clear trend implies neutral management signal for TSLL ETF.
Valuation Analysis
Leveraged ETFs like TSLL ETF skip standard P/E or EPS.
AUM stands at 5.32B, expense ratio 0.95%.
Beta at 4.13x signals high volatility vs. market.
Dividend yield 6.79% with $0.96 rate adds appeal.
No direct peers; compare to TSLA Bull funds.
TSLL ETF appears fairly valued for its risk, not cheap or rich.
Recent Earnings & Catalysts
TSLL ETF reports no independent earnings; mirrors TSLA daily.
Tesla’s Q1 tied to EV deliveries, energy storage beats.
No specific guidance; catalysts include robotaxi event, FSD push.
Tesla results drove TSLL ETF price dips on margin worries.
Bullish Case
Tesla EV demand rebounds in China, Cybertruck ramps.
Energy storage growth outpaces autos at 100%+ YoY.
AI via Optimus robot offers long catalysts.
FSD subscriptions boost recurring revenue realistically.
Bearish Case
Competition from BYD, GM erodes EV share.
Margin squeeze from price cuts hits profits.
Regulatory probes on autonomy add hurdles.
Economic slowdown curbs auto buys.
Market Sentiment & Investor Psychology
Short interest data sparse for ETFs; TSLA elevated.
Options skew to puts amid volatility.
Institutional ownership high at 403M shares out.
Retail chases momentum, now cooling to neutral.
Overall sentiment: neutral with bearish tilt.
Short-Term Outlook
Technicals show RSI neutral, MACD sell.
Volume supports swings; watch $14.01 resistance.
Expect sideways chop unless TSLA breaks key levels.
Medium to Long-Term Outlook
Leverage fits tactical trades, not buy-hold.
Tesla growth hinges on AI, energy moat.
Competitive risks loom; financials solid but volatile.
Long-term investors should watch, not accumulate TSLL ETF.
FAQ Section
Is TSLL ETF a buy right now?
Neutral signals suggest hold; high risk for short-term traders only.
What is the TSLL ETF price target?
No consensus; technicals eye $14.01 resistance, $9.49 support.
TSLL ETF forecast?
Sideways short-term; ties to TSLA EV/AI progress.
What are major risks for TSLL ETF?
Leverage decay, TSLA competition, volatility spikes.
TSLL technical analysis key takeaway?
Bearish below 200-day MA; wait for bullish cross.
Suggestions
- Compare with TSLY ETF for covered call strategies
- See our TSLA stock forecast
- Read our leveraged ETF risks breakdown
Conclusion
Hold for now. TSLL ETF suits active traders on TSLA bets, but leverage erodes in ranges. Watch technical breaks amid Tesla catalysts.
Disclaimer: This article is for informational purposes only and not financial advice.