SOXL Technical Analysis: Trend, Levels & Outlook March 2026
Direxion Daily Semiconductor Bull 3X Shares (SOXL) is a leveraged ETF designed to deliver three times the daily performance of the semiconductor sector, specifically tracking semiconductor companies included in major technology indices. Because the semiconductor industry sits at the center of modern technology—from artificial intelligence to cloud computing—SOXL has become one of the most actively traded leveraged ETFs among retail traders.
In March 2026, semiconductor stocks remain a focal point for investors due to strong demand from artificial intelligence infrastructure, data centers, and advanced computing technologies. As a leveraged instrument, SOXL tends to amplify both bullish rallies and market corrections in the semiconductor sector. This article analyzes SOXL’s current price trend, important support and resistance levels, and key technical indicators such as RSI, MACD, and volume.
Current Price Trend in March 2026
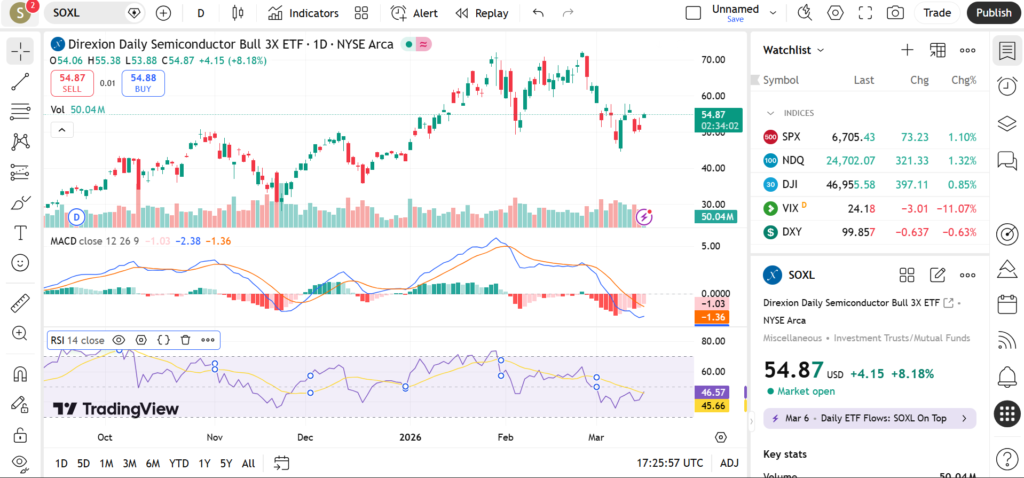
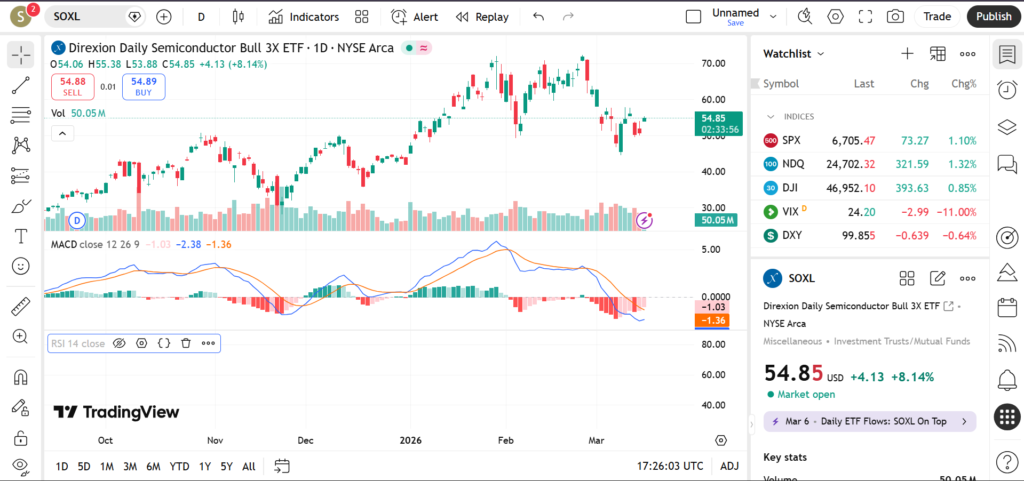
SOXL has shown an active trading pattern during March 2026, reflecting ongoing momentum in semiconductor stocks. The ETF has experienced strong upward impulses followed by consolidation periods, creating a pattern of higher highs and higher lows in certain trading sessions.
The 20-day moving average has acted as a dynamic support level during short-term pullbacks. When price remains above this average, traders often interpret it as a sign that bullish momentum in the semiconductor sector remains intact.
The 50-day moving average continues to serve as an important medium-term trend indicator. Previous pullbacks toward this level have often resulted in temporary stabilization before new rally attempts.
The 200-day moving average represents the broader long-term trend baseline. As long as SOXL maintains price above this level, the semiconductor sector may continue to display underlying bullish strength despite periodic corrections.
Key Support and Resistance Levels
Support and resistance zones play a major role in leveraged ETFs because price movements often accelerate once these levels are broken.
One key support level appears near recent swing lows where price previously rebounded after a correction. This zone represents an area where buyers showed interest during earlier pullbacks.
Another support level lies near the 50-day moving average. This level often acts as a medium-term support zone during trending markets.
A deeper support region exists near the 200-day moving average, which could serve as a longer-term stabilization point if the semiconductor sector experiences a broader correction.
On the resistance side, the first key level appears near recent rally highs where upward momentum slowed.
The next resistance zone lies slightly above that region, near previous breakout attempts that struggled to maintain follow-through buying.
A higher resistance level exists near the ETF’s multi-month highs. A break above this level could attract momentum traders looking for continuation in the semiconductor rally.
Indicators – RSI, MACD, Volume
RSI readings for SOXL currently remain in the neutral to moderately bullish range. This suggests the ETF still has room to move higher before entering overbought territory.
MACD signals during March have shown periods of bullish crossovers, reflecting strengthening momentum during semiconductor rallies.
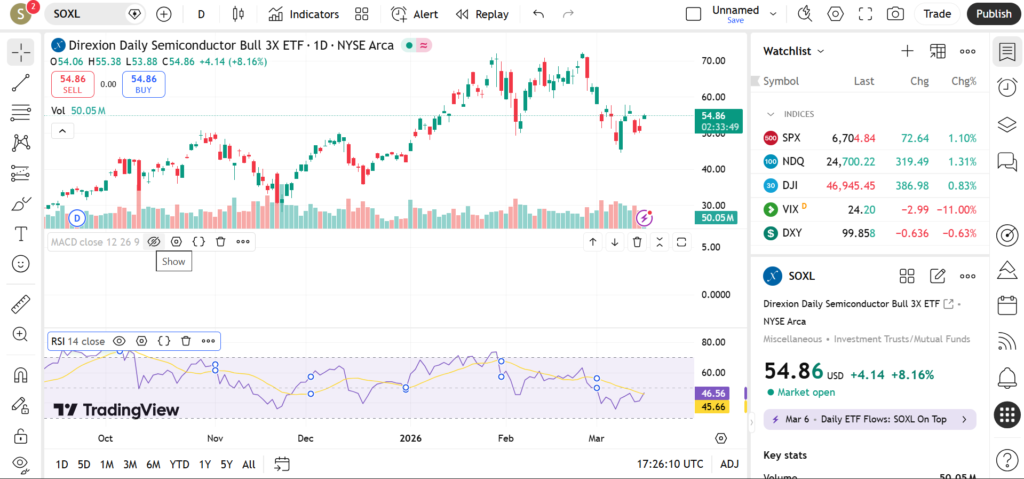
Volume behavior shows that trading activity increases during strong upward moves, indicating growing interest from traders seeking leveraged exposure to the sector.
Short-Term Outlook for SOXL in March 2026
SOXL’s outlook remains closely linked to the performance of semiconductor companies. If demand for AI-related chips and data-center hardware continues to grow, the ETF could attempt to retest previous highs.
However, any slowdown in technology stocks could lead to short-term corrections.
What traders are watching
• Semiconductor sector momentum
• Breakout attempts above recent highs
• Reactions near the 50-day moving average
• Volume expansion during rallies
• Technology sector earnings announcements
Risks and Important Notes
Leveraged ETFs amplify both gains and losses. Because SOXL targets three times the daily movement of the semiconductor sector, volatility can increase significantly during market swings.
Unexpected news events or macroeconomic developments can cause technical levels to fail.
This analysis is educational only and should not be considered financial advice.
For further insights, traders may explore technical analysis of other technology ETFs or semiconductor sector funds.