SOXL Technical Analysis: Trend, Levels & Outlook March 2026
Direxion Daily Semiconductor Bull 3X Shares (SOXL) is a leveraged ETF designed to deliver three times the daily performance of the semiconductor sector, primarily tracking semiconductor stocks in the semiconductor index. The ETF belongs to the leveraged technology sector and is widely traded by active traders seeking amplified exposure to semiconductor stocks.
Semiconductor companies remain central to the global technology industry, especially due to demand for artificial intelligence chips, data centers, and consumer electronics. As a result, SOXL has become a popular instrument for traders looking to capitalize on short-term moves in the semiconductor industry.
This article examines SOXL’s price trend, support and resistance levels, and technical indicators such as RSI, MACD, and trading volume to help traders understand its potential movement in March 2026.
Current Price Trend in March 2026
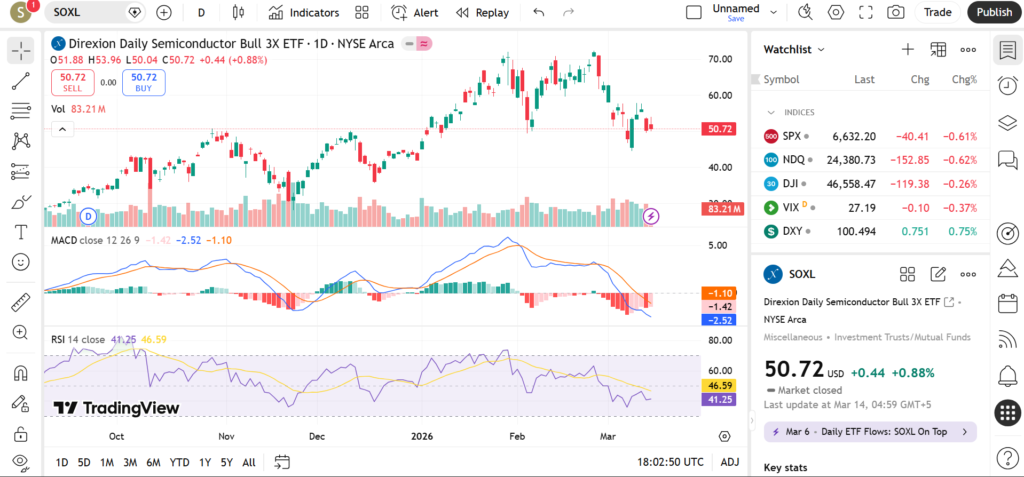
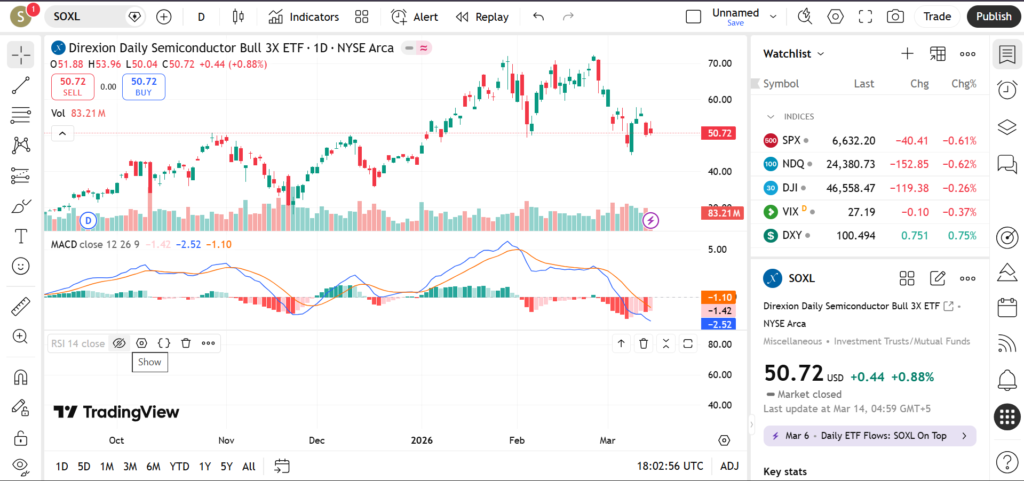
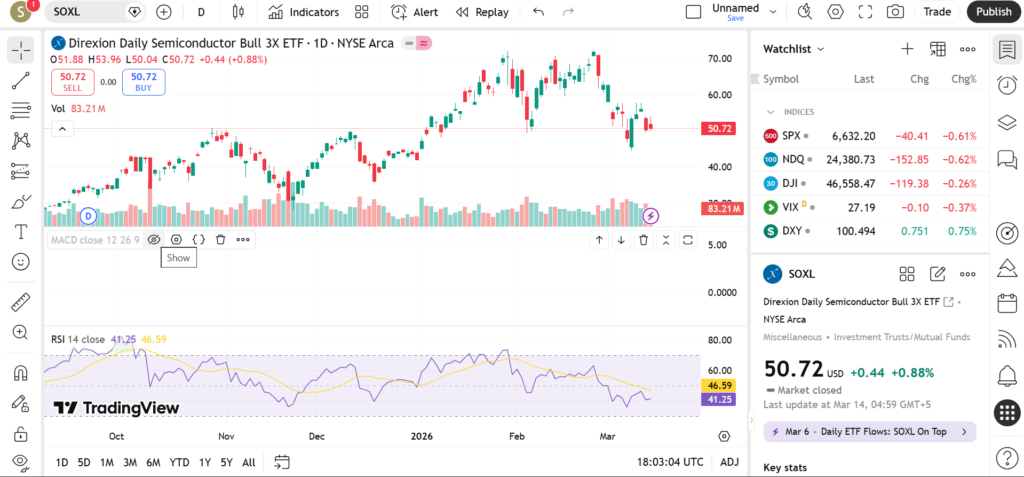
SOXL has experienced strong upward momentum over the past several months, driven largely by continued strength in semiconductor stocks. However, leveraged ETFs tend to experience sharper corrections during market pullbacks.
The 20-day moving average has been acting as short-term support during recent pullbacks. Price has repeatedly bounced from this level, indicating continued buying interest.
The 50-day moving average remains upward sloping, confirming that the medium-term trend is still bullish.
Meanwhile, the 200-day moving average sits significantly below current price levels, reinforcing the broader uptrend that has been in place since late 2025.
Recent price action suggests a temporary consolidation near recent highs, which often occurs after extended rallies.
Key Support and Resistance Levels
The first support level appears near the recent swing low, which formed after the latest correction.
Another support level lies around the 50-day moving average, which has historically attracted buyers.
A deeper support zone may appear near the 200-day moving average, which acts as long-term support.
On the resistance side, the first barrier sits near the recent swing high.
Additional resistance could appear near previous yearly highs, where momentum previously slowed.
Breaking above these levels could indicate continued bullish momentum in semiconductor stocks.
Indicators – RSI, MACD, Volume
RSI currently sits near the upper neutral range, suggesting bullish momentum but not yet extreme overbought conditions.
MACD remains in positive territory, although the histogram shows signs of slightly slowing momentum.
Volume activity has been strong during rallies, reflecting high trader interest in semiconductor ETFs.
Short-Term Outlook for SOXL in March 2026
The overall technical outlook for SOXL remains bullish, supported by rising moving averages and strong sector momentum.
Traders are watching:
• Breakout above recent highs
• Support near the 50-day moving average
• Semiconductor earnings and AI demand
• Volume spikes during rallies
• Tech sector sentiment shifts
Risks and Important Notes
Leveraged ETFs like SOXL amplify both gains and losses due to daily leverage resets. Unexpected macro events or sector news can quickly invalidate technical setups.
This article is for educational purposes only and should not be considered financial advice.