NVD Technical Analysis: Trend, Levels & Outlook March 2026
GraniteShares 2x Short NVDA Daily ETF (NVD) is a leveraged inverse ETF designed to deliver two times the opposite daily performance of NVIDIA stock. This ETF belongs to the inverse leveraged equity ETF sector, giving traders a way to potentially benefit from short-term declines in one of the largest semiconductor companies in the world.
NVD has gained attention in March 2026 as semiconductor stocks remain highly volatile following the massive rally driven by artificial intelligence demand. Because NVIDIA has been one of the strongest performers in the technology sector in recent years, traders sometimes use inverse ETFs like NVD to hedge positions or speculate on temporary pullbacks.
This article analyzes NVD’s current trend, key support and resistance levels, and technical indicators such as RSI, MACD, and volume to help traders understand how the ETF may behave in the near term.
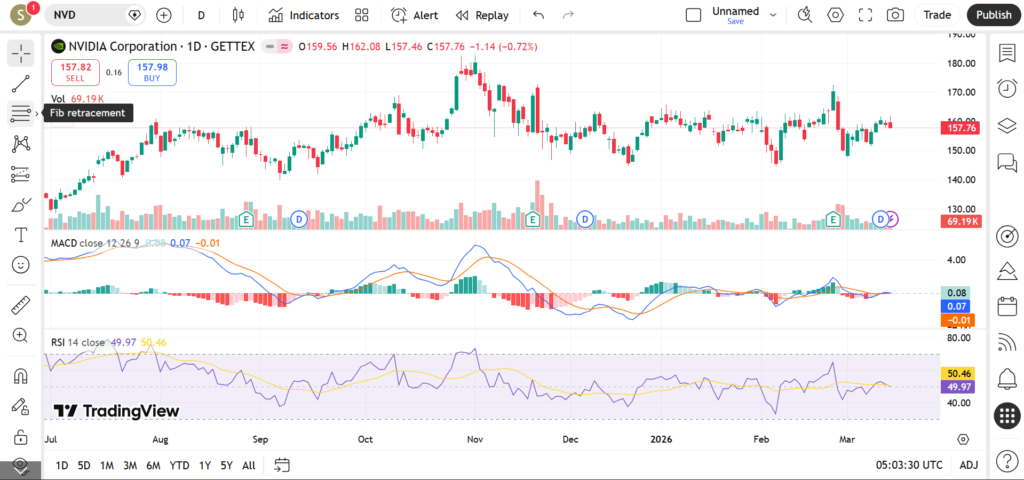
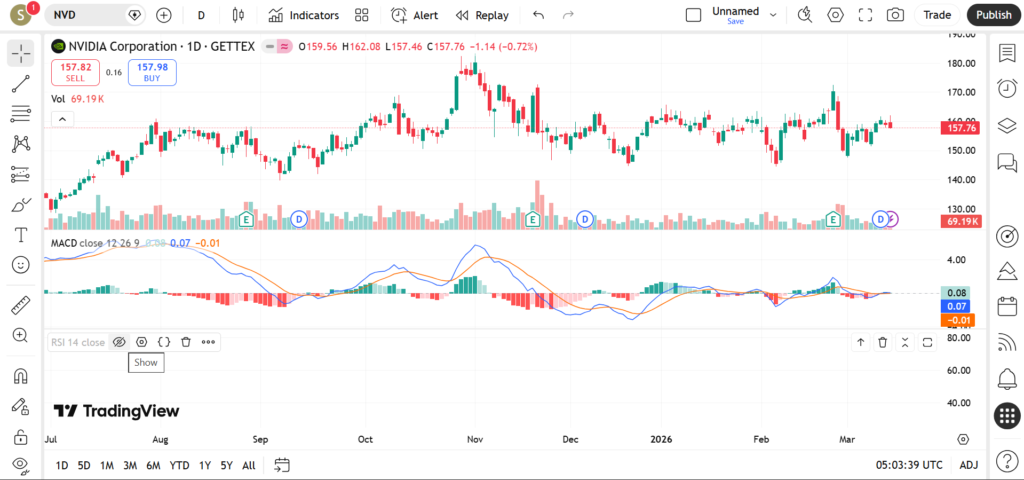
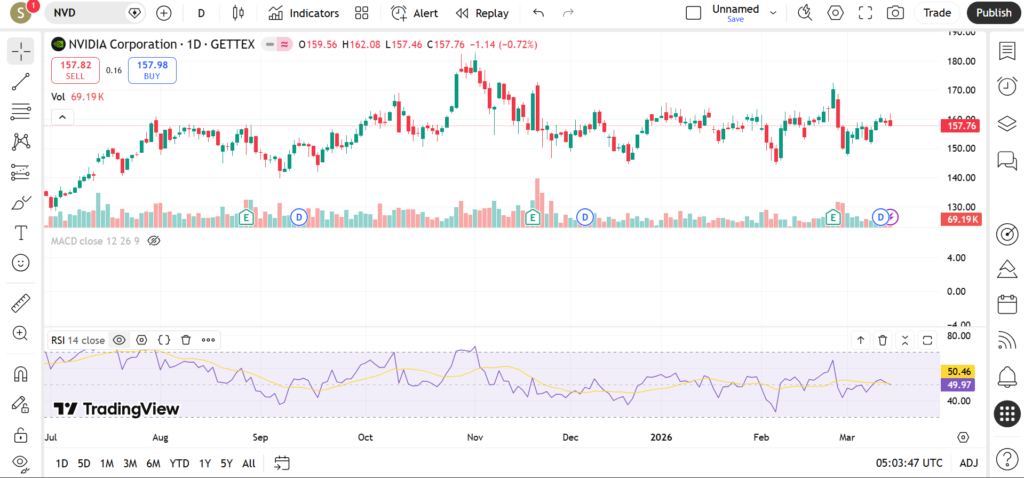
Current Price Trend in March 2026
During March 2026, NVD has shown short-term fluctuations reflecting NVIDIA’s price swings. Since NVD moves inversely to NVDA, periods when NVIDIA rallies typically lead to declines in NVD, while pullbacks in NVIDIA often trigger upward spikes in the ETF.
The 20-day moving average has recently been trending downward, suggesting that the short-term trend for NVD remains weak. This is consistent with the broader bullish momentum in semiconductor stocks.
The 50-day moving average also appears to be sloping downward, reinforcing the idea that the medium-term trend has been bearish for this inverse ETF.
However, occasional sharp upward spikes occur when NVDA experiences sudden corrections, highlighting the highly reactive nature of leveraged inverse products.
The 200-day moving average remains an important long-term reference level, though NVD has generally traded below it for extended periods due to the long-term strength of NVIDIA shares.
Key Support and Resistance Levels
Important Support Levels
The first support level appears near the most recent swing low, where the ETF stabilized following recent selling pressure.
Another support zone lies near the lower boundary of the recent trading range, which has acted as a floor during previous declines.
A deeper support level may exist near longer-term lows, where the ETF previously attempted to stabilize during strong semiconductor rallies.
Important Resistance Levels
The first resistance area is near the recent swing high formed during NVIDIA’s latest pullback.
Another resistance level appears near the 50-day moving average, which may act as dynamic resistance during rallies.
Higher resistance could appear near the 200-day moving average, where sellers may become more active if NVD attempts a stronger recovery.
Indicators – RSI, MACD, Volume
RSI
The RSI indicator has frequently moved between neutral and oversold territory, reflecting persistent downward pressure on the ETF during NVIDIA’s rallies.
Occasional spikes toward the neutral range occur when NVDA experiences short-term corrections.
MACD
MACD has generally shown bearish momentum, with the MACD line often remaining below the signal line.
However, temporary bullish crossovers may occur during sharp semiconductor pullbacks.
Volume
Volume spikes in NVD often coincide with sudden drops in NVIDIA’s share price, highlighting how traders use this ETF for short-term hedging or speculative trades.
Short-Term Outlook for NVD in March 2026
The technical outlook for NVD in March 2026 remains dependent on NVIDIA’s price movement. As long as semiconductor stocks maintain strong momentum, NVD may continue facing downward pressure.
However, short-term corrections in the AI sector could trigger sharp but temporary rallies in the ETF.
What traders are watching
- NVIDIA price movements and semiconductor sector sentiment
- Potential spikes during tech sector corrections
- RSI shifts from oversold toward neutral territory
- Volume spikes indicating short-term trading activity
- Macro events impacting semiconductor demand
Risks and Important Notes
Inverse leveraged ETFs like NVD carry significant risks due to daily leverage and compounding effects. These products are typically designed for short-term trading rather than long-term holding.
Unexpected news, earnings announcements, or macroeconomic developments can quickly invalidate technical levels.
This article is for educational purposes only and does not constitute financial advice.
For broader market insights, traders may also explore analysis of semiconductor ETFs, NVDA stock trends, and technology sector ETFs.