
BITO Technical Analysis: Trend, Levels & Outlook March 2026
ProShares Bitcoin Strategy ETF (BITO) is one of the first exchange-traded funds designed to provide exposure to Bitcoin through futures contracts rather than holding the cryptocurrency directly. As a result, BITO belongs to the crypto-linked ETF sector, allowing traditional stock market investors to gain indirect exposure to Bitcoin price movements without using cryptocurrency exchanges or digital wallets.
Traders are paying close attention to BITO in March 2026 as Bitcoin continues to attract both institutional and retail interest following several years of mainstream adoption and regulatory developments. Because BITO tracks Bitcoin futures, its price behavior tends to mirror broader crypto market sentiment. In this article, we will examine BITO’s current trend, important support and resistance levels, and key technical indicators including RSI, MACD, and trading volume to help traders understand how the chart is evolving during this period.
Current Price Trend in March 2026
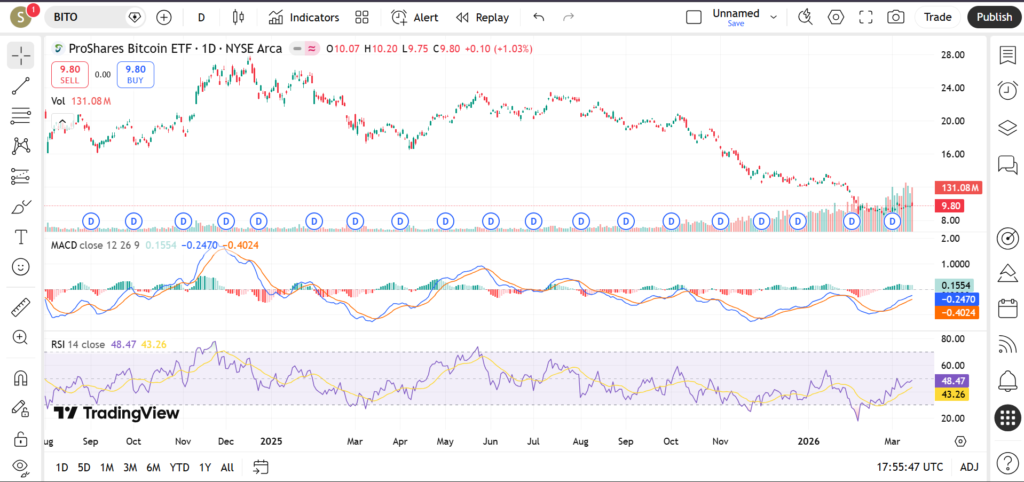
During March 2026, BITO has been moving in a moderately bullish trend with intermittent pullbacks, reflecting ongoing volatility in the cryptocurrency market. Bitcoin itself often experiences strong momentum phases followed by consolidation periods, and this behavior is clearly visible in BITO’s chart structure.
From a moving average perspective, the 20-day moving average has been trending upward for much of the month, suggesting that short-term bullish momentum remains intact. Price has occasionally dipped toward this moving average during brief corrections but has generally recovered quickly afterward.
The 50-day moving average continues to serve as an important medium-term trend indicator. BITO has been trading above this average for several weeks, which many traders interpret as confirmation that the broader trend remains constructive.
Looking at the longer timeframe, the 200-day moving average represents a key long-term support level that traders monitor carefully. When an ETF stays above this moving average for extended periods, it often signals sustained bullish sentiment.
Recent price action shows higher lows forming after each pullback, a pattern that frequently indicates ongoing accumulation by market participants. However, the pace of gains has slowed slightly, suggesting that the market could enter a temporary consolidation phase before making its next directional move.
Key Support and Resistance Levels
Support and resistance levels provide insight into where buying or selling pressure might emerge.
Important Support Levels
The first major support level appears near the most recent swing low, where the ETF previously rebounded after a short-term pullback. This level represents an area where buyers recently stepped in to defend the price.
Another important support zone lies around the 50-day moving average, which has acted as dynamic support in previous pullbacks.
Further below, a deeper support region exists near the 200-day moving average, which often attracts long-term buyers and institutional traders.
Round-number price levels may also act as psychological support areas, as traders frequently place orders around these zones.
Important Resistance Levels
On the upside, the first resistance level can be found near the recent swing high created during the latest rally. This area previously triggered selling pressure as traders took profits.
Another resistance zone exists near a cluster of prior highs formed during earlier consolidation periods.
A more significant resistance area could appear near previous yearly highs, where strong upward momentum previously slowed.
A decisive breakout above these resistance zones with strong trading volume could indicate renewed bullish momentum, while repeated rejection may lead to continued sideways movement.
Indicators – RSI, MACD, Volume
RSI (Relative Strength Index)
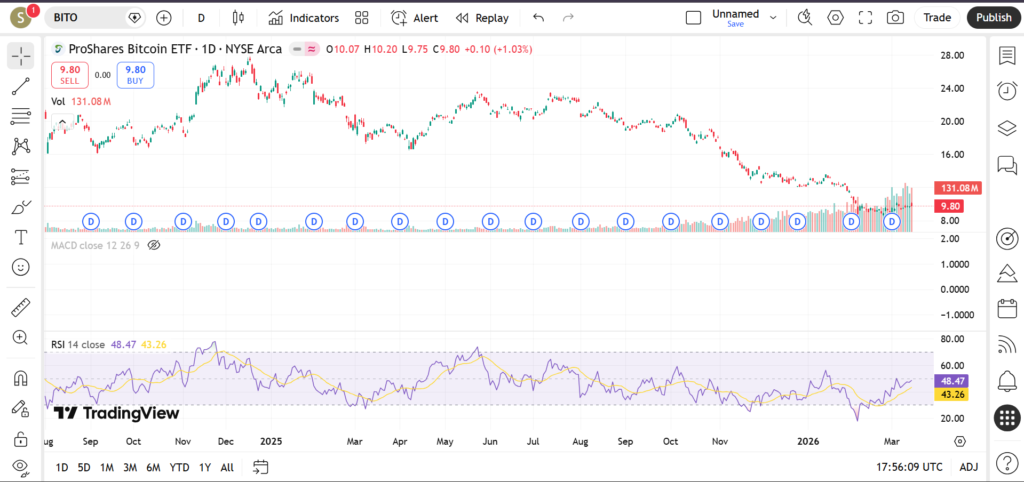
The RSI indicator for BITO has recently been fluctuating in the upper neutral range, suggesting that bullish momentum is present but not yet stretched into extreme territory.
If RSI were to approach the overbought zone above 70, it might indicate strong buying pressure but also a potential short-term cooling period.
A move back toward the mid-range could signal consolidation before the next move.
MACD
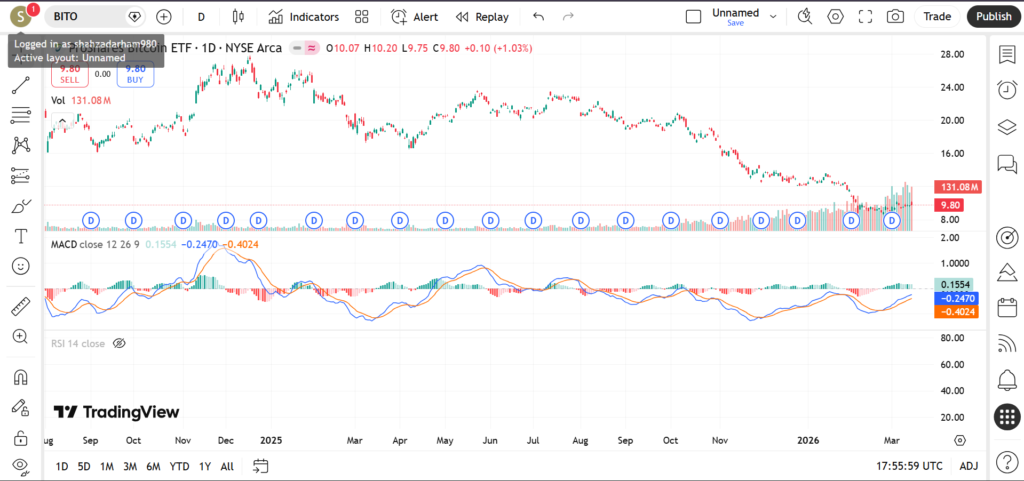
The MACD indicator has recently shown positive momentum, with the MACD line remaining above the signal line during much of the recent rally.
However, the gap between the two lines has started narrowing slightly, which sometimes indicates that bullish momentum is slowing.
Traders often watch for new crossovers to identify potential shifts in trend strength.
Volume
Volume patterns in BITO have shown periodic spikes during strong price movements, which is common in crypto-linked ETFs. Increased volume during rallies often suggests active participation from traders responding to Bitcoin price momentum.
Lower volume during pullbacks may indicate that selling pressure is relatively limited.
Short-Term Outlook for BITO in March 2026
The overall technical structure of BITO in March 2026 appears moderately bullish, supported by higher lows and upward-sloping moving averages. However, the slowing momentum observed in recent sessions suggests that the ETF may enter a consolidation period before the next major move.
If BITO successfully breaks above recent resistance levels, it could indicate that bullish sentiment in the cryptocurrency market remains strong. On the other hand, a drop below key support levels could signal a deeper retracement.
What traders are watching
- Bitcoin price momentum influencing ETF performance
- Potential breakout above recent swing highs
- RSI approaching overbought or returning to neutral levels
- Volume spikes during rallies or corrections
- Macro developments related to crypto regulation or institutional adoption
Risks and Important Notes
Technical analysis provides insights into price patterns, but it cannot predict future outcomes with certainty. Cryptocurrency-linked ETFs such as BITO are particularly sensitive to rapid changes in market sentiment, regulatory news, and macroeconomic developments.
Because BITO tracks Bitcoin futures contracts, its performance may also diverge slightly from the spot price of Bitcoin due to futures roll costs and other structural factors.
This analysis is intended for educational purposes only and should not be considered financial advice. Traders should always conduct their own research and apply proper risk management strategies.
For additional market insights, readers may also explore analysis of crypto-related stocks, blockchain ETFs, and major market ETFs to gain a broader understanding of market trends.