SPDN technical analysis March 2026 – support, resistance and hedge outlook
Direxion Daily S&P 500 Bear 1X Shares (SPDN) is an inverse ETF designed to deliver the opposite of the daily performance of the S&P 500 Index. It is often used as a tactical hedge or a short‑term bearish expression on U.S. large‑cap equities by traders who prefer not to short futures or individual stocks directly.
In March 2026, SPDN is on traders’ radar as markets reassess interest‑rate expectations, inflation trends and recession risks. This article walks through SPDN’s current trend, key support and resistance zones, and popular indicators such as RSI, MACD and volume so traders can better frame bearish or hedging strategies without relying on gut feeling alone.
Current Price Trend in March 2026
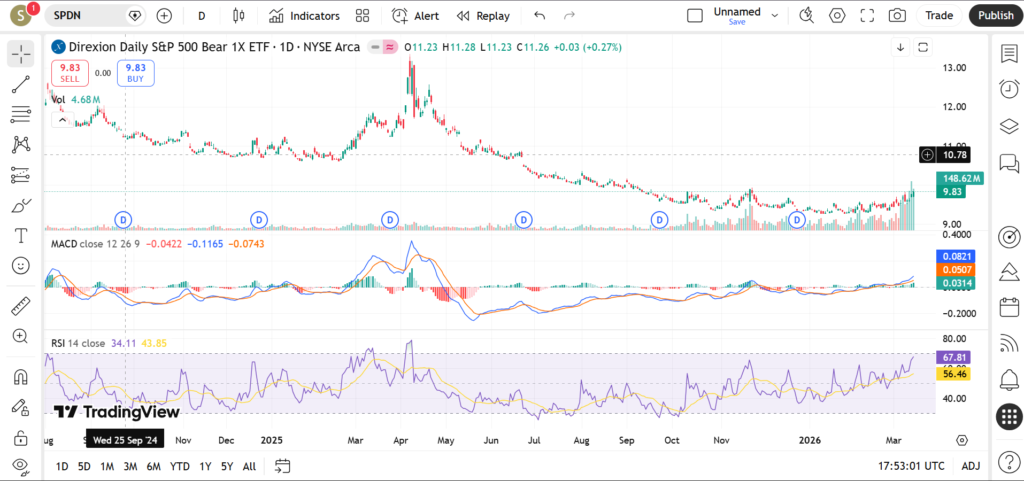
Over the last 12 months, SPDN has generally experienced a mild negative trend, reflecting the S&P 500’s tendency to grind higher overall during that period. A 12‑month trend reading around a mid‑single‑digit decline suggests that while there have been episodes of equity weakness, they have not turned into a sustained bear market, and rallies in SPDN have tended to fade.
In the nearer term, projected ranges for the next 3–12 months suggest SPDN could trade within a fairly contained band, consistent with a market where the S&P 500 oscillates rather than collapses. With inverse products like SPDN, this typically appears as a series of lower highs on the daily chart as each spike higher in SPDN coincides with short‑lived pullbacks in the underlying index. Because SPDN targets daily inverse performance, short‑term swings can be sharp, especially around macro data releases, central‑bank decisions and earnings seasons.
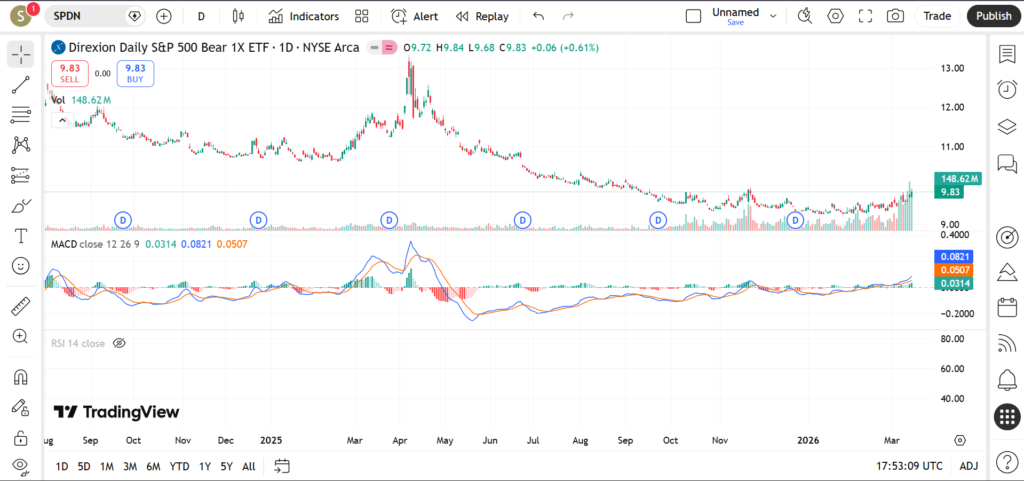
Relative to its moving averages, SPDN often spends much of its time below the 200‑day moving average when the S&P 500 is in an uptrend. The 20‑ and 50‑day averages tend to act as local reference points for traders to identify whether a short‑term bout of equity weakness is turning into something more persistent. If SPDN remains below a downward‑sloping 50‑ and 200‑day average, many participants interpret it as evidence that the underlying equity market trend is still broadly bullish, even if tactically overbought.
Key Support and Resistance Levels
With SPDN, “support” levels often correspond to periods when the S&P 500 is near local highs, while “resistance” levels align with market pullbacks where bearish hedging demand spikes.
Key support levels
- Recent multi‑month lows
The lower bound of SPDN’s projected 3‑month range (around the low‑teens per share) represents a key support zone where the ETF may have bounced in recent months. A break below this region could indicate that the S&P 500 has resumed a strong uptrend, reducing the perceived need for bearish hedges. - Round‑number support
Round prices in the teens often attract more attention, especially when they align with previous consolidation areas or the lower edge of statistical prediction ranges. Holds above such psychological levels can encourage traders to maintain or initiate hedges, while clean breaks below can signal that downside equity risk is being repriced as less urgent. - Historical lows within the last year
Any 12‑month low area, as implied by the modestly negative 12‑month trend reading, serves as a deeper support benchmark. If SPDN revisits that zone and holds, it may illustrate a floor in near‑term bearish sentiment; a decisive breakdown could suggest continued equity strength.
Key resistance levels
- Upper bound of 3‑month projected range
The upper edge of the 3‑month prediction band, close to the mid‑teens, provides an important resistance area where past SPDN rallies have tended to fade. A break above this level on strong volume could signal that equity markets are undergoing a more serious correction, prompting more demand for bearish exposure. - 200‑day moving average
The 200‑day moving average, often above spot price in a rising equity market, can act as a major overhead barrier. If SPDN surges to test or pierce this moving average, it may reflect a shift toward a more prolonged risk‑off phase in the S&P 500. - Recent swing highs on equity pullbacks
Each time the S&P 500 experiences a notable dip, SPDN tends to print a local high; these levels form a series of resistance points on the chart. Traders may watch how SPDN behaves when it approaches prior swing highs, looking for either rejection (equities stabilizing) or breakout (equities entering a deeper correction).
In practice, traders often combine these zones with intraday price action to fine‑tune entries and exits for hedging strategies rather than treating any single level as absolute.
Indicators – RSI, MACD, Volume
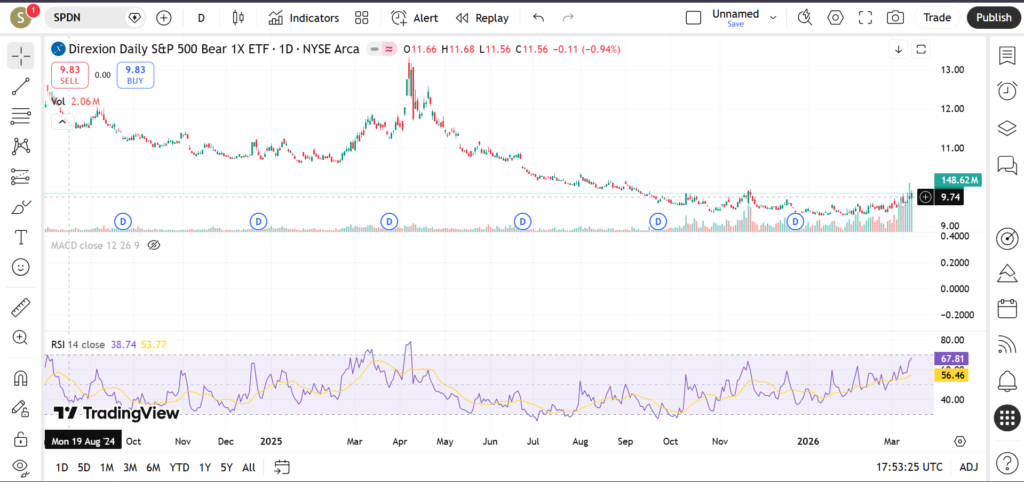
RSI on SPDN frequently oscillates between oversold and neutral territory because the S&P 500 has, on balance, traded in an upward trend over the last year. When equities rally strongly, SPDN often drifts lower and RSI can move toward oversold readings, signaling a stretched bullish phase in the underlying index. Conversely, when the S&P 500 sells off and SPDN spikes, RSI can snap toward or above 70, flagging potentially overextended bearish positioning in the short term.
MACD for SPDN provides a view of momentum in bearish sentiment. During periods when the S&P 500 is steadily rising, MACD on SPDN will often remain below the zero line with occasional small bullish crossovers that fade quickly. More meaningful bearish equity phases show up as MACD lines turning up decisively, crossing the signal line and moving closer to or above zero, reflecting sustained demand for downside exposure.
Volume in SPDN tends to swell during episodes of market stress – such as sharp index drops or high‑profile macro events – as traders rush to put on hedges or speculative short‑equity positions. Outside these periods, daily volume can contract, mirroring complacency or a lack of urgency about downside protection. For technicians, spikes in SPDN volume around resistance levels can hint at fear‑driven hedging, while low volume near support may suggest that investors remain comfortable with equity risk.
Short‑Term Outlook for SPDN in March 2026
In March 2026, the technical backdrop for SPDN suggests that the prevailing environment still favours the underlying S&P 500, but with pockets of volatility that can create tactical opportunities for hedgers. The modestly negative 12‑month trend and relatively narrow prediction ranges point to a market where frequent short‑term pullbacks may be more common than a deep, sustained bear market.
For short‑term traders, this means SPDN might remain most useful as a flexible hedge during event‑driven risk spikes rather than as a long‑term core position. Price behaviour around the projected support and resistance bands, combined with shifts in volume and momentum indicators, can help traders judge whether a given equity dip is likely to be bought or whether it could extend.
What traders are watching
- How SPDN behaves near the lower edge of the 3‑month projection range, which may coincide with recent lows and key support.
- Reactions at the upper projection band and any attempt to approach the 200‑day moving average, signalling potential escalation in equity downside.
- Major macro events such as central‑bank meetings, inflation prints and employment data that can quickly shift sentiment on the S&P 500.
- Earnings seasons for mega‑cap components of the S&P 500, which often drive broad index moves and, by extension, SPDN’s inversely related price action.
- Changes in SPDN’s volume profile around support and resistance, looking for confirmation of genuine hedging flows versus quieter, technical mean‑reversion.
Risks and Important Notes
As with any inverse ETF, SPDN’s behaviour can diverge from a simple one‑for‑one inverse over longer holding periods due to daily rebalancing and compounding effects. Unexpected macro news, geopolitical shocks or surprise policy actions can cause the S&P 500 to gap, leading SPDN to blow through technical levels before traders can react. Technical analysis can help frame probabilities and scenarios, but no level is guaranteed to hold.
Traders should also consider that SPDN is intended primarily for short‑term tactical use rather than long‑term buy‑and‑hold strategies. Before using SPDN as a hedge, it is important to align position size, time horizon and risk tolerance with personal circumstances and, where necessary, seek independent financial advice. The discussion here is educational and not a recommendation for any specific individual